Visual Mode
Introduction
Visual Mode is an innovative feature that makes identifying and resolving accessibility issues easy. By providing real-time visual feedback, it helps you spot issues directly on your website.
Installing the Browser Extension
To use Visual Mode, you’ll need to install the AAArdvark browser extension. This allows the platform to connect to your site and enable the visual interface for identifying and logging accessibility issues. Follow these steps to get started:
- Choose your browser:
- Install the extension:
Follow the prompts to install the extension in your chosen browser. For detailed instructions, click the links above corresponding to the browser-specific guides. - Verify the connection:
Once the extension is installed, ensure it’s active. If you’re already using AAArdvark, please refresh the page.
You’re now ready to access Visual Mode and start auditing your site!
Visual Mode
To access Visual Mode:
- Open the Site Dashboard.
- Click the Visual Mode tab.
Important: If you haven’t run a scan on the site yet, Visual Mode will not be accessible. Be sure to run a scan first.
What’s new: Visual Mode now opens directly on your live site instead of loading inside AAArdvark. The browser extension injects the Visual Mode interface right onto your page, so you’re interacting with your actual site instead of a copy loaded in an iframe. That means fewer loading issues and a more reliable experience overall.
Pages with Authentication
If you attempt to open a site page in Visual Mode that requires authentication or logins, a modal window will prompt you to sign in before proceeding.
Before you can log in or view issues in Visual Mode for that page, you must first sign in by following the steps below.
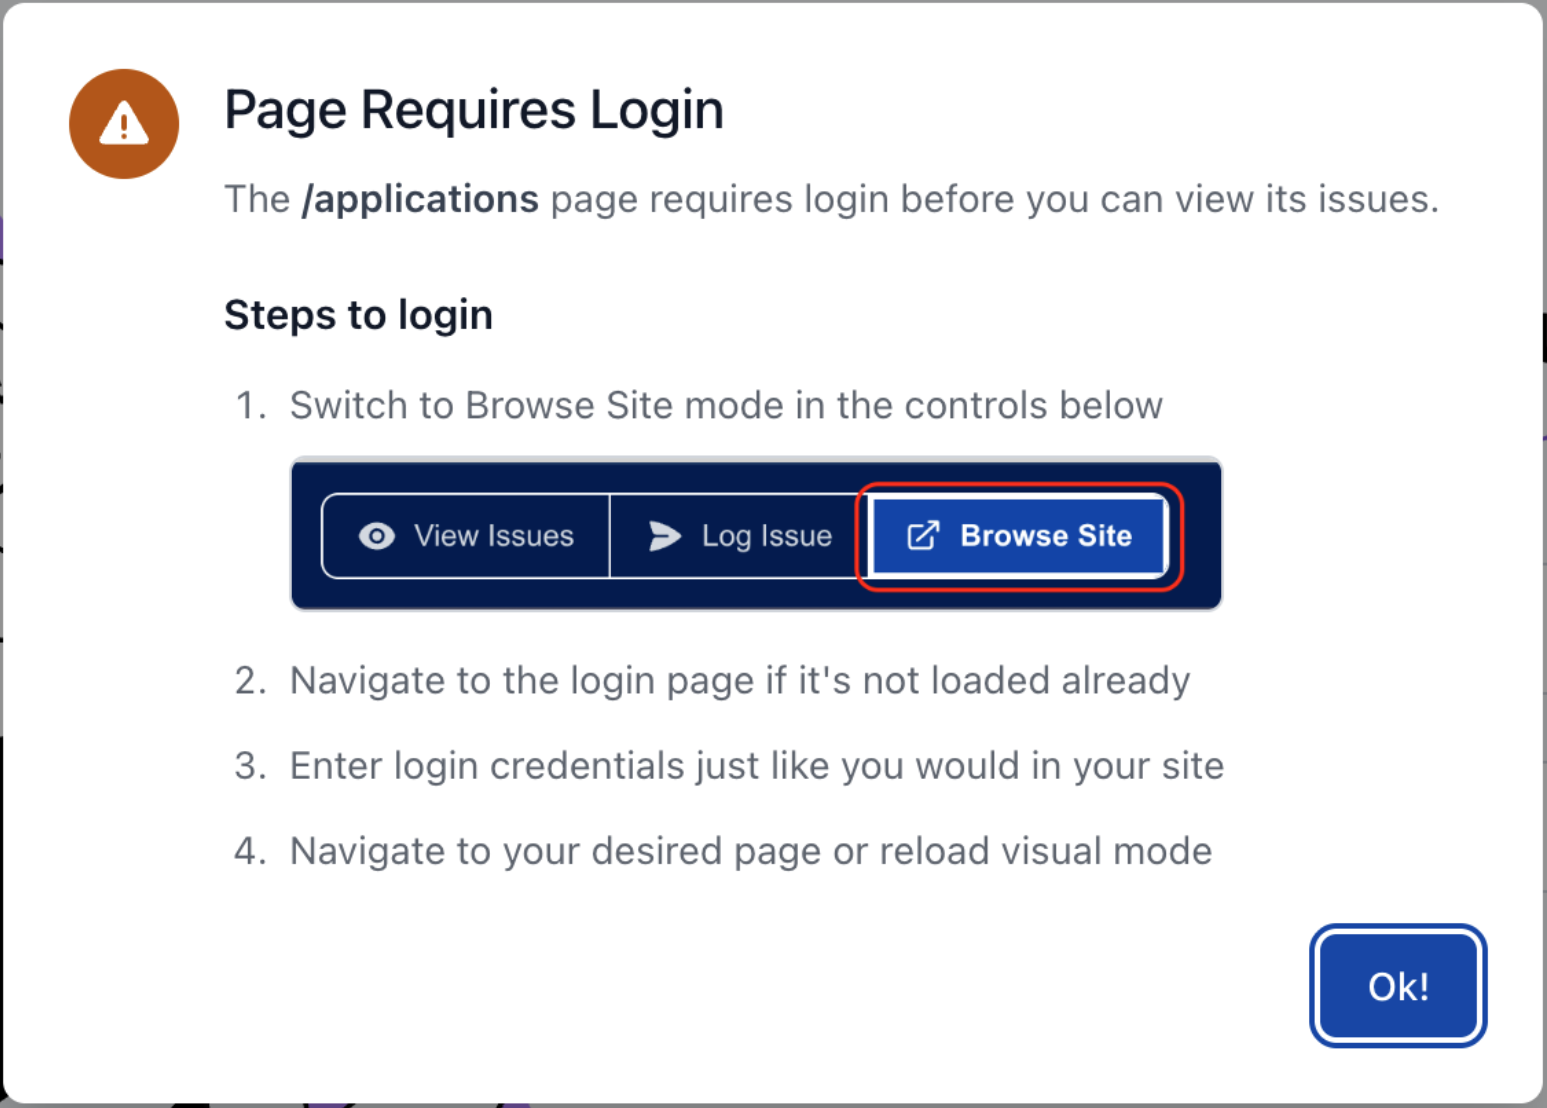
To log in and continue:
- Switch to Browse Site mode in the controls below.
- Navigate to the login page if it’s not loaded already.
- Enter your login credentials just like you would on your site.
- Navigate to your desired page or reload Visual Mode.
Note: This modal only appears when you jump to a specific page – from the page switcher or a link from the app – not when you’re browsing freely in Visual Mode. It also only applies to pages set up to require login under site authentication; if a page isn’t configured that way, you won’t see it.
Login and redirect issues: If your site’s login flow redirects you somewhere other than the page you started on (common with SSO or multi-step logins), Visual Mode can lose track of where you meant to go. Log in first in Browse Site mode, then use the Pages list to navigate directly to the page you want, rather than relying on the redirect to land you there. If it still isn’t working, reach out to support – login flows vary a lot from site to site.
Browse Site
The Browse Site button allows you to navigate the page and explore the site.
- Enabled: Hides the issue instance icons and allows you to freely navigate the site and switch between pages.
- Disabled: Displays icons pinpointing each issue instance on the page. Click an icon to view more details.
Tip: Use the toggle to switch between reviewing issues and exploring the site.

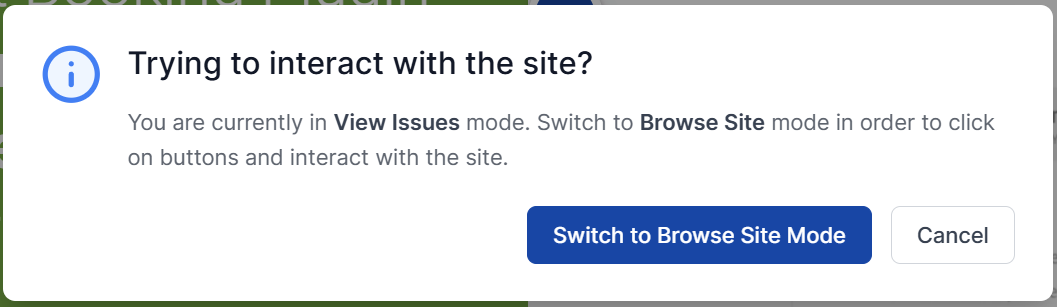
Additionally, if you are in View Issues mode, clicking on an issue (or clicking multiple times quickly) will prompt you to switch to Browse Site so you can properly navigate the site and interact with it
Turning Visual Mode On and Off
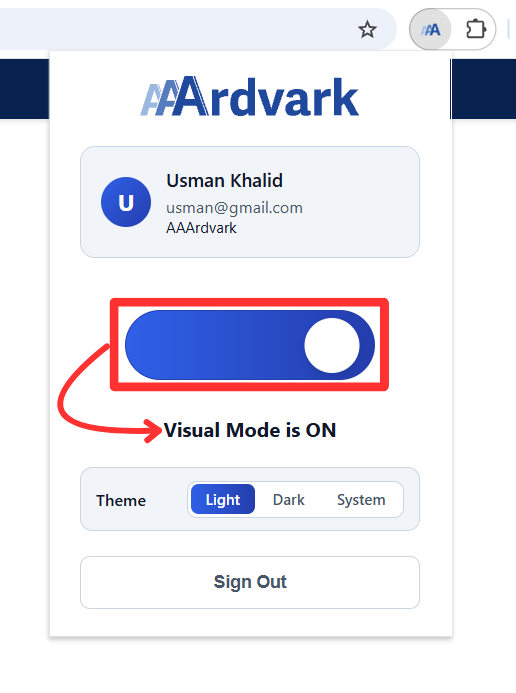
Since Visual Mode now runs directly on your live site, you’ll sometimes want to see the page without it, without leaving the site entirely.
Click the AAArdvark icon in your browser toolbar to open the extension popup, then use the toggle to turn Visual Mode off. You’ll see your site exactly as your visitors would, with no icons or overlays. Click it again to bring Visual Mode back.
Errors and Warnings
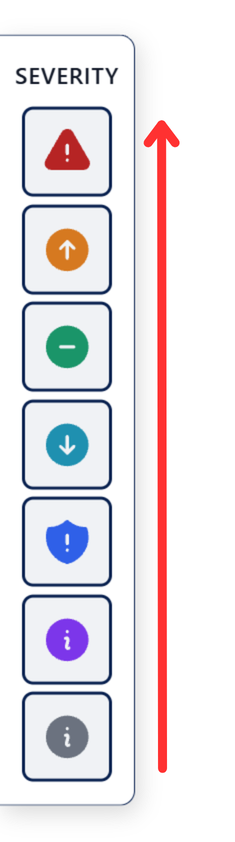
The icons on your page represent Errors and Warnings, each identified by specific colors and icons. If you have enabled Notices in your site settings, you’ll also see icons for the Notices.
Errors are categorized by severity, from critical issues to minor inconveniences.
Critical

Specific users cannot access content and/or functionality, and no workaround is available.
Very High

Certain users are very likely to have difficulty accessing content and/or functionality.
High

Understanding or accessing content and/or functionality may be difficult for some users.
Moderate

Degraded user experience for some users.
Low

Minor inconvenience or a best practice recommendation.
Warnings

Potential issues that require manual review to confirm their impact.
Notices
Potential improvements to be aware of or consider if they’re relevant to your goals.
On the left-hand side of the screen, a button with the text “Toggle Sort by severity” will show you a navigation region that provides a quick reference for these severity levels. Click any icon to show issues by severity levels or hover to view details.
Issue Instance List
In Visual Mode, the Issue Instance List shows every issue instance detected on the current page.
How it works
- Click an issue instance in the list to jump directly to its location on the page. The element will be highlighted with a red outline.
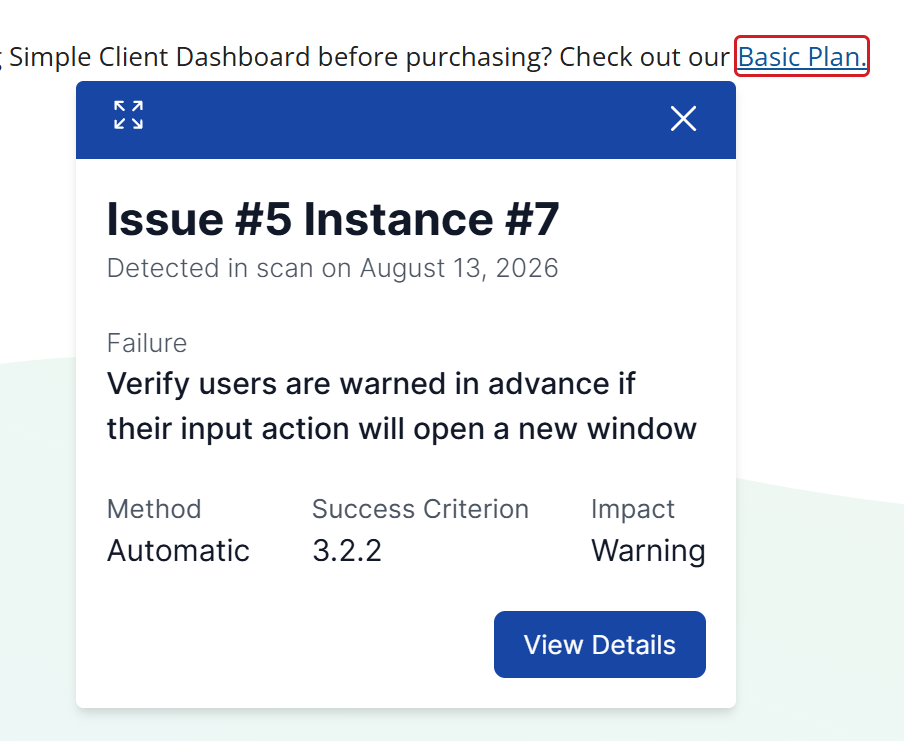
- Alternatively, click an icon on the page to open the instance details and access the View Details option.
Issue Instance Details
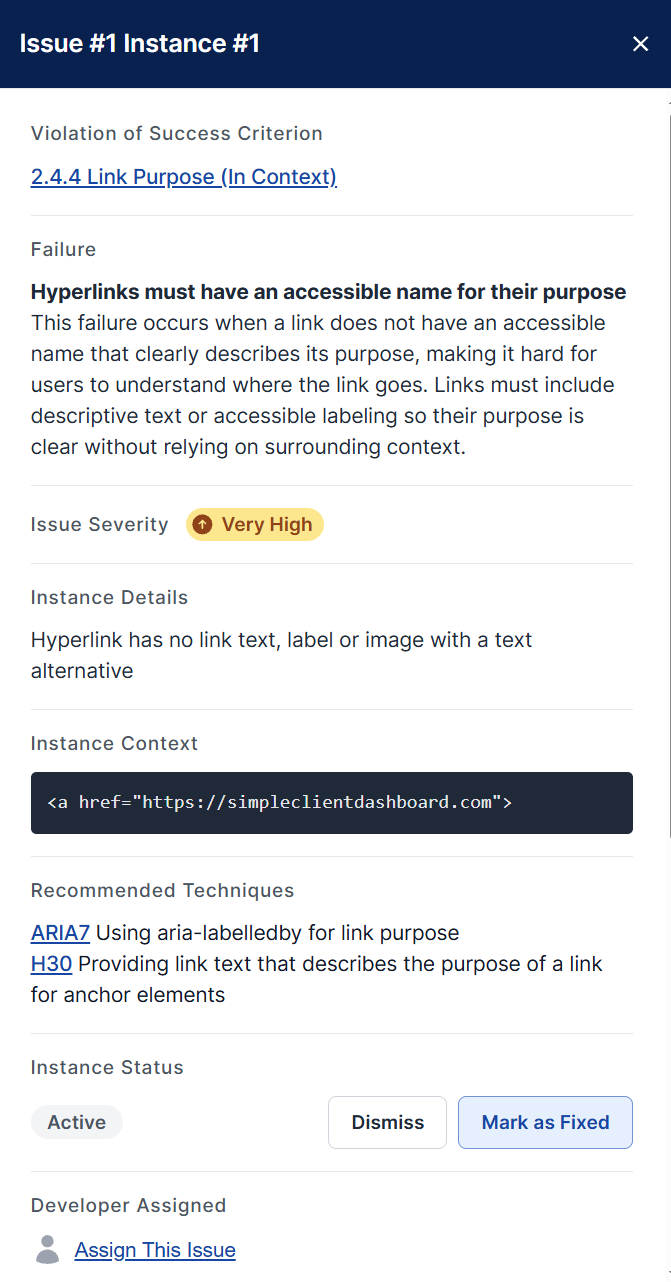
The issue instance displays the following information:
- Violation of Success Criterion: The Success Criteria that the failure violated, leading to the WCAG in Plain English site for more information.
- Failure: Describes the specific accessibility problem that was detected for the element.
- Issue severity: Indicates the criticality level of the issue (e.g., High, Medium, Low).
- Instance Details: Prompts for a review of the issue, and how to fix the issue.
- Recommended Techniques: Lists recommended solutions or guidelines to fix the issue.
- Screenshot of Issue: A screenshot that indicates where the issue was logged and located on the page.
- Instance Context: Shows the actual code snippet where the issue was found.
- Instance Status: Shows the current state of the issue (e.g., Reopened, Fixed) with options to update it.
- Developer Assigned: Specifies who is responsible for fixing the issue.
- Comments: A section for team discussions or notes about the issue.
- Add a comment: An input field to submit new comments or feedback.
Tip: You can edit issues directly in Visual Mode, assign them to team members, or leave comments.
Filtering
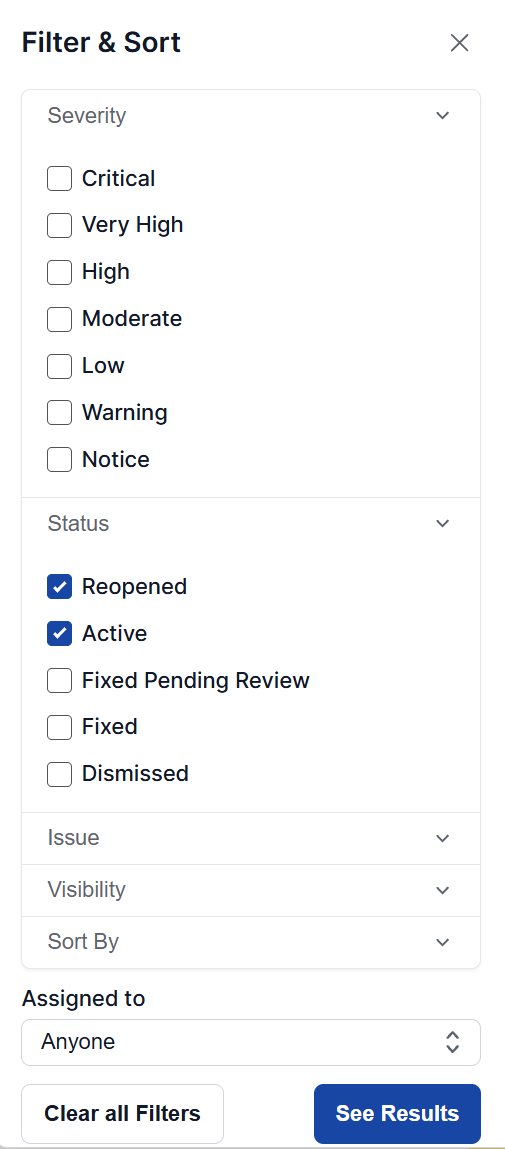
- Filter the issues list by Severity, Status, Issue, Visibility, or Assigned to.
- Sort the list under Sort By: Most Severe, Least Severe, Highest Priority, Lowest Priority, Most Recent, or Oldest.
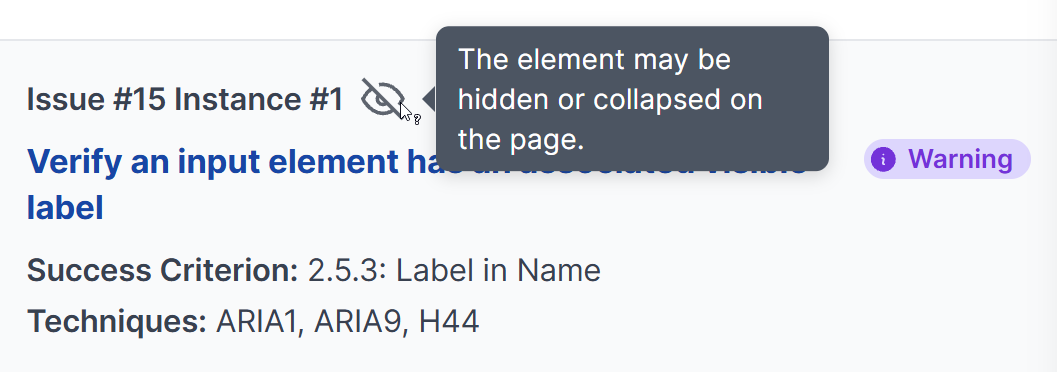
If an issue is hidden or collapsed on the page in Visual Mode, an icon indicating that will appear right next to its listing within the Issues list. Hovering over the icon will display a message indicating its status.
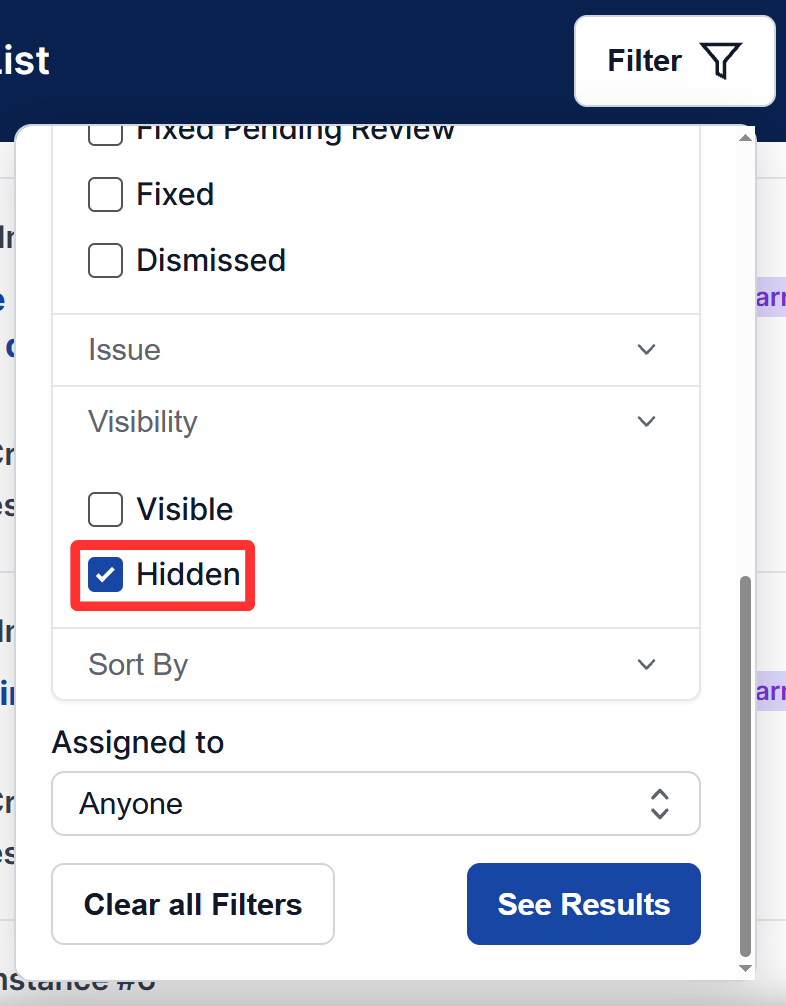
You can select Hidden under the Visibility tab in the Filters menu to only filter out hidden issues within the issues list.
Viewing The Issues
Much like viewing the details of an issue from a scan, you can also modify the issue in Visual Mode, change who it is assigned to, and comment on the issue.
Logging an Issue
Manually log accessibility issues using Visual Mode to capture anything automated scans may miss.
Steps to log an issue
- Ensure you’re in Visual Mode.
- Click the Log Issue button.

- Click the element on the page where the issue occurs. It’ll highlight with a light red background and a dotted outline, and the Record New Issue form opens with a new Selected Element section at the top, showing the element’s selector.

The Record New Issue form with the new Selected Element section at the top, showing the highlighted element’s selector.
- If the wrong element got selected (for example, a link that wraps a small inline element with little padding), click Change element in the Selected Element section instead of starting over. This opens a refine step: use the arrow keys (or the on-screen arrows) to move the selection. Up/Down moves to the parent or child element, and Left/Right moves across sibling elements. Once the correct element is highlighted, click Confirm to return to the form with that element selected. Your failure, severity, and notes are kept. This replaces the old workaround of hand-editing CSS in devtools to make a small target element easier to click.

The element refiner open on the page, showing the breadcrumb, the element’s opening tag, and the arrow-key controls to move the selection.
- In the modal, select the appropriate Failure. The Success Criterion and default Severity for the issue will auto-populate, but you can manually adjust the severity level if required.
- Choose the Scope for the issue: Global if it applies sitewide, Pattern if it applies to a group of similar pages, or Page-specific if it only applies to this page. Defaults to Page-specific. The scope also shows as a badge on the issue in the Issues list and in the instance detail panel.
- If there are multiple possible solutions, choose the best option for the situation and add any additional notes needed.
- Check the box to indicate if the issue is hidden by default, and include steps to make it visible if applicable.

Recording an issue prompt; the user can select which failure applies to the issue, the success criterion that relates, a recommended solution, severity level, some additional notes, and whether or not the element is visible by default.
- Once submitted, the issue will appear on the page as an icon and in the Issues tab.
- You can end the recording by clicking the Record Issue button again or using the Esc key.
Scan Page
In addition to being able to scan pages when adding them, you are also able to scan the page you navigate to in Visual Mode (once added).

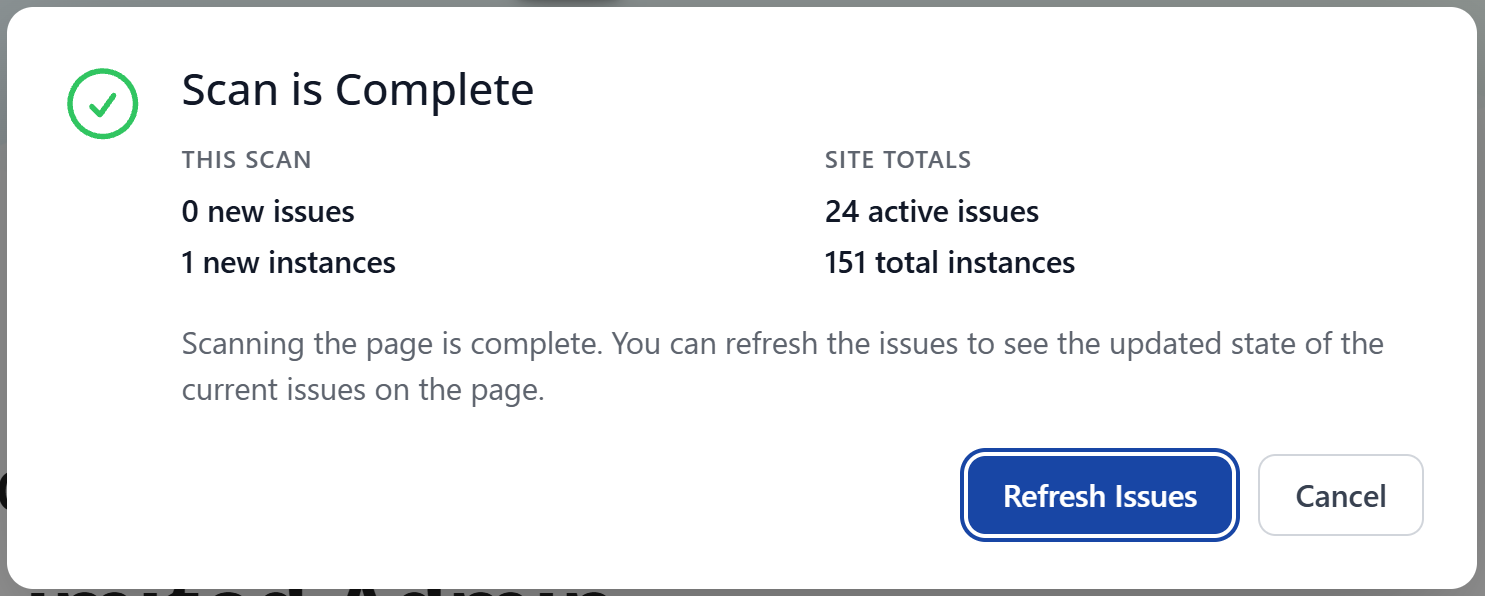
Once a scan is complete while in Visual Mode, a pop-up appears notifying of the Scan result. You should be able to see the updated state of the current issues on the page right away when clicking Refresh Issues.
Manual Testing Status
The bottom bar also includes a Manual Testing control showing the page’s current status with a colored dot: Not Started, In Progress, Tested, or Skipped. Click it to open a menu and change the status without leaving Visual Mode.

The Manual Testing control in the bottom bar, open to show the four status options: Not Started, In Progress, Tested, and Skipped.
Picking the status you’re already on does nothing – it only saves when the status actually changes, showing a brief “Saving…” state followed by a confirmation. If a save fails, it rolls back to the previous status and lets you know.
Browsing to a page in Visual Mode never changes its status by itself – viewing a page isn’t the same as testing it, so the status only moves when you set it here or from the Pages screen.
Only Owners, Administrators, Project Managers, and Accessibility Testers can change the status this way; the control doesn’t appear for Developers or Clients, or if the page hasn’t been added to AAArdvark yet.
It’s fully keyboard-operable: open the menu with Enter, Space, or an arrow key, move between options with the arrow keys, and close it with Escape.
See Manual Testing Workflow for the full rundown on tracking audit progress, including the same four statuses set from the Pages screen.
Switching Pages
If the page you want is already added to AAArdvark, you don’t need to browse to it manually. Click Pages in Visual Mode, and select the page you want from the list. Visual Mode loads that page and its issues right away.

The Pages control in Visual Mode, showing the list of pages added to the app.
This also works in reverse: if you browse to /index.html directly instead of using the Pages list, Visual Mode still recognizes it as the page already stored as /. Its issues load right away instead of showing a banner offering to add a new page, and that page shows the Current badge if you open the Pages list.
Light and Dark Theme
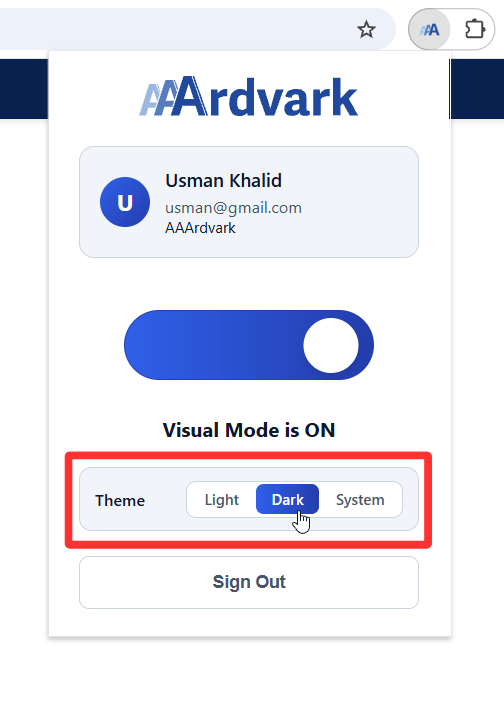
Visual Mode supports Light, Dark, and System theme. Click the AAArdvark icon in your browser toolbar to open the extension popup, and choose your theme there, whichever is easier on your eyes.