

Dashboard Overview
Introduction
Access your AAArdvark dashboard by logging into your account. The dashboard is your central hub for managing workspaces, sites, scans, teams, and account details. Let’s explore how to navigate and make the most of it.
Account
When you log into AAArdvark, you will see your name in the top right corner, followed by a dropdown arrow.
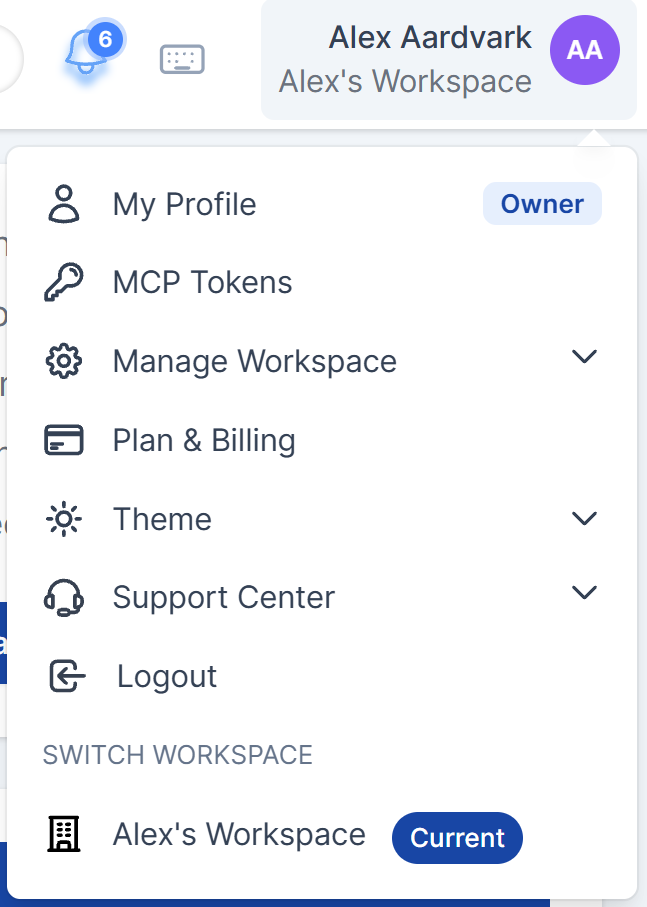
My Profile
The My Profile page lets you:
- Update your name and password
- Adjust your notification settings
- Review active browser sessions for added security
- Set up two-factor authentication
- Delete your profile (if necessary)
MCP Tokens
The AAArdvark MCP server is currently in a limited beta, so MCP Tokens may not appear in your account dropdown yet. You can sign up for the beta here, and reach out to our support team with any questions.
Once it’s enabled for your workspace, the MCP Tokens page is where you create and revoke the tokens that connect an AI assistant, such as Claude, Cursor, or Codex, to your AAArdvark accessibility data. Generate a named token, copy it once, and paste the ready-made setup snippet into your client.
For the full walkthrough, including connecting each supported client and revoking a token, see the MCP Server guide.
Manage Workspace
Open Manage Workspace from the account dropdown to invite and manage users, adjust their roles, update the workspace name and logo, set report branding, and reach the workspace-wide settings pages below.
Learn more about managing workspace settings and users in this guide.
Workspace Settings
Settings for the workspace are adjusted here, including viewing and editing General Workspace Settings, report branding, and canceling the Workspace. Canceling a workspace deletes all of the data associated with it.
Learn more about the Workspace Settings in this guide.
Teams
The Teams page will allow you to manage all your teams assigned to the workspace and which users are a part of the teams.
It also enables you to add new users by sending invites to them, along with removing and editing existing users.
Learn more about managing teams in this guide.
Site Tags
The Site Tags page lets you add, manage, and organize tags for your sites. From here, you can create new tags, assign them to sites, and update or remove existing ones.
Learn more about site tags in this guide.
Custom Issues
The Custom Issues page holds the reusable custom issue types for your workspace, for barriers the automated scanner doesn’t check for. Click Add Custom Issue to create one, giving it an Issue Title, a mapped WCAG Success Criterion, and a Severity. The table lists each custom issue with the number of times it has been recorded, and Edit / Delete actions.
These are the Custom Failures you select when recording an issue by hand in Visual Mode. Learn more about custom manual issues in this guide.
Integrations
The Integrations page will allow you an overview of all the integrations you have enabled on all of your sites.
Take a peek at the integrations we offer.
Plan & Billing
On the Plan & Billing page, you can:
- Manage and upgrade plans for your workspace sites
- Add or update payment methods
- Access invoices for previous purchases or upgrades
View more information on how to manage your plan and billing here.
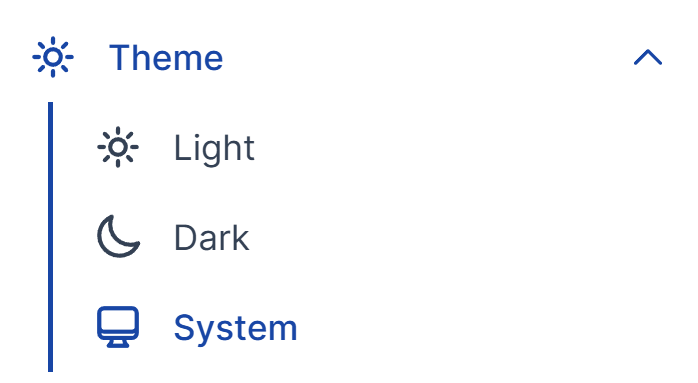
Theme
On the Theme page, you can:
- Light Theme: a bright background with dark text
- Dark Theme: a dark background with light text
- System: automatically matches your device’s theme settings
Support Center
Visit the Support Center to:
- Access Help & Support for FAQs and guides
- Review the Terms of Service
- Explore the Privacy Policy
From here you can also submit a support request or browse the most frequently searched help topics for a quick answer. If you still have questions, feel free to contact our support team.
Log Out
If you’re done for the day or just need to, you’re able to Log Out.
Workspace Dashboard
The Workspace Dashboard is your home screen. It lists every site in your workspace as a single row, and each row tells you the one thing to do about that site next. By default it groups the sites that need work at the top, but you can re-sort the list (see Groups and sorting below).
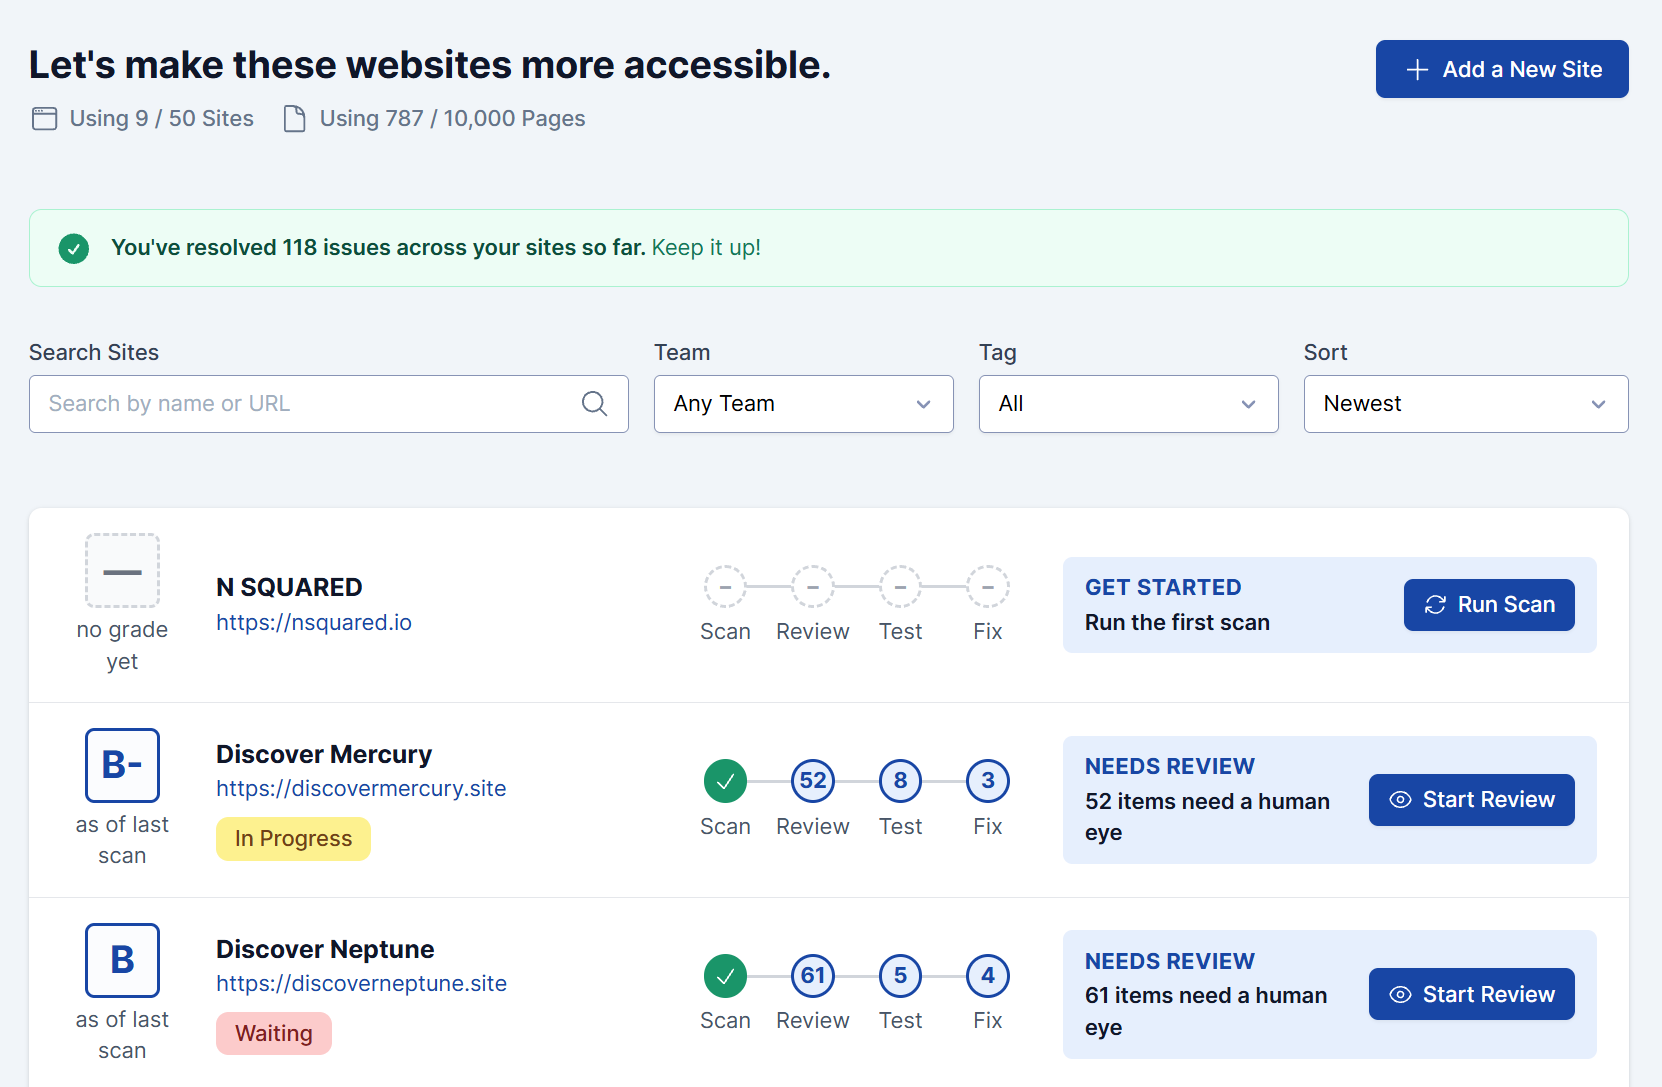
The greeting and workspace usage
The top of the page shows a short greeting that changes each time you visit, sometimes with your name and the time of day. Next to it you’ll see how much of your plan you’re using: sites used out of your limit, and pages used out of your limit. If you’re out of sites or pages and your role can change the plan, an Upgrade workspace link appears beside the counts.
The Add a New Site button sits at the top right. On roles that can’t add sites directly, such as Client, it reads Request a new site instead.
Your progress so far
If your workspace has more than one site and your team has resolved issues recently, a green banner near the top sums up the wins, for example, “You’ve fixed 12 issues across your sites this week.” In a quiet week, it falls back to your all-time total. This banner appears for team members who can see every site in the workspace.
Each site row
Reading left to right, every row shows:
- The site’s letter grade as of its last scan, with “as of last scan” below it, or “no grade yet” for a site that hasn’t been scanned. A small up or down arrow with a point change sits under the letter when the score has moved over roughly the last quarter (about 90 days). It compares with the score from 90 days ago, not with the previous scan. This is the same Accessibility Score shown on the Site Dashboard, captured at the last scan rather than recalculated live.
- The site name, which opens that site’s Site Dashboard, with the site URL below it and any site tags underneath that.
- A Scan → Review → Test → Fix track showing where the site stands in the accessibility testing workflow. Each step shows one of: a count of what’s waiting there, a checkmark when that step is clear and a scan has confirmed it, a spinner while a scan is running, or a dash when there’s nothing to do there yet. A site that has never been scanned shows dashes across the whole track. Counts above 99 display as “99+”.
- A next step box calling out the single most useful thing to do for that site right now: a short label, a one-line summary, and a button to act on it. A site with items waiting on review, for example, shows “Needs review”, “236 items need a human eye”, and a Start Review button; other states point you to Run Scan, Start manual audit, or fixing the issues that are left. A site that has completed the whole workflow reads In Good Standing with no button. What it asks you to do is matched to your role, so it won’t tell you to do something your role can’t, and two people looking at the same site can see different next steps. If your role can view a site but not act on it, it shows a short status and a View Issues button instead of an instruction like Run Scan or Start manual audit.

Groups and sorting
By default the list leads with the sites that need attention. The Sort control above the list changes that ordering, and also whether the sites are split into groups:
- Needs Attention (the default) splits your sites into two groups. Needs your attention collects sites that haven’t been scanned yet, have items waiting on review, or are sitting in one of the lowest grade bands (D or C−). On track collects sites that are progressing or in good standing. Each group heading carries a count, and within a group the rows are listed alphabetically.
- Alpha, Newest, and Oldest show one flat list of every site in that order, with no groups.
Your choice is remembered for your next visit.

Searching and filtering
Above the list you can:
- Search by site name or URL. Type your term and press Enter or click the search icon; the list won’t re-filter while you’re still typing. Use the clear (X) button or press Escape to reset it.
- Filter by Team and by Tag. These apply as soon as you change them.

If nothing matches, you’ll see “No sites found” with a Clear filters link.
Running a scan from the list
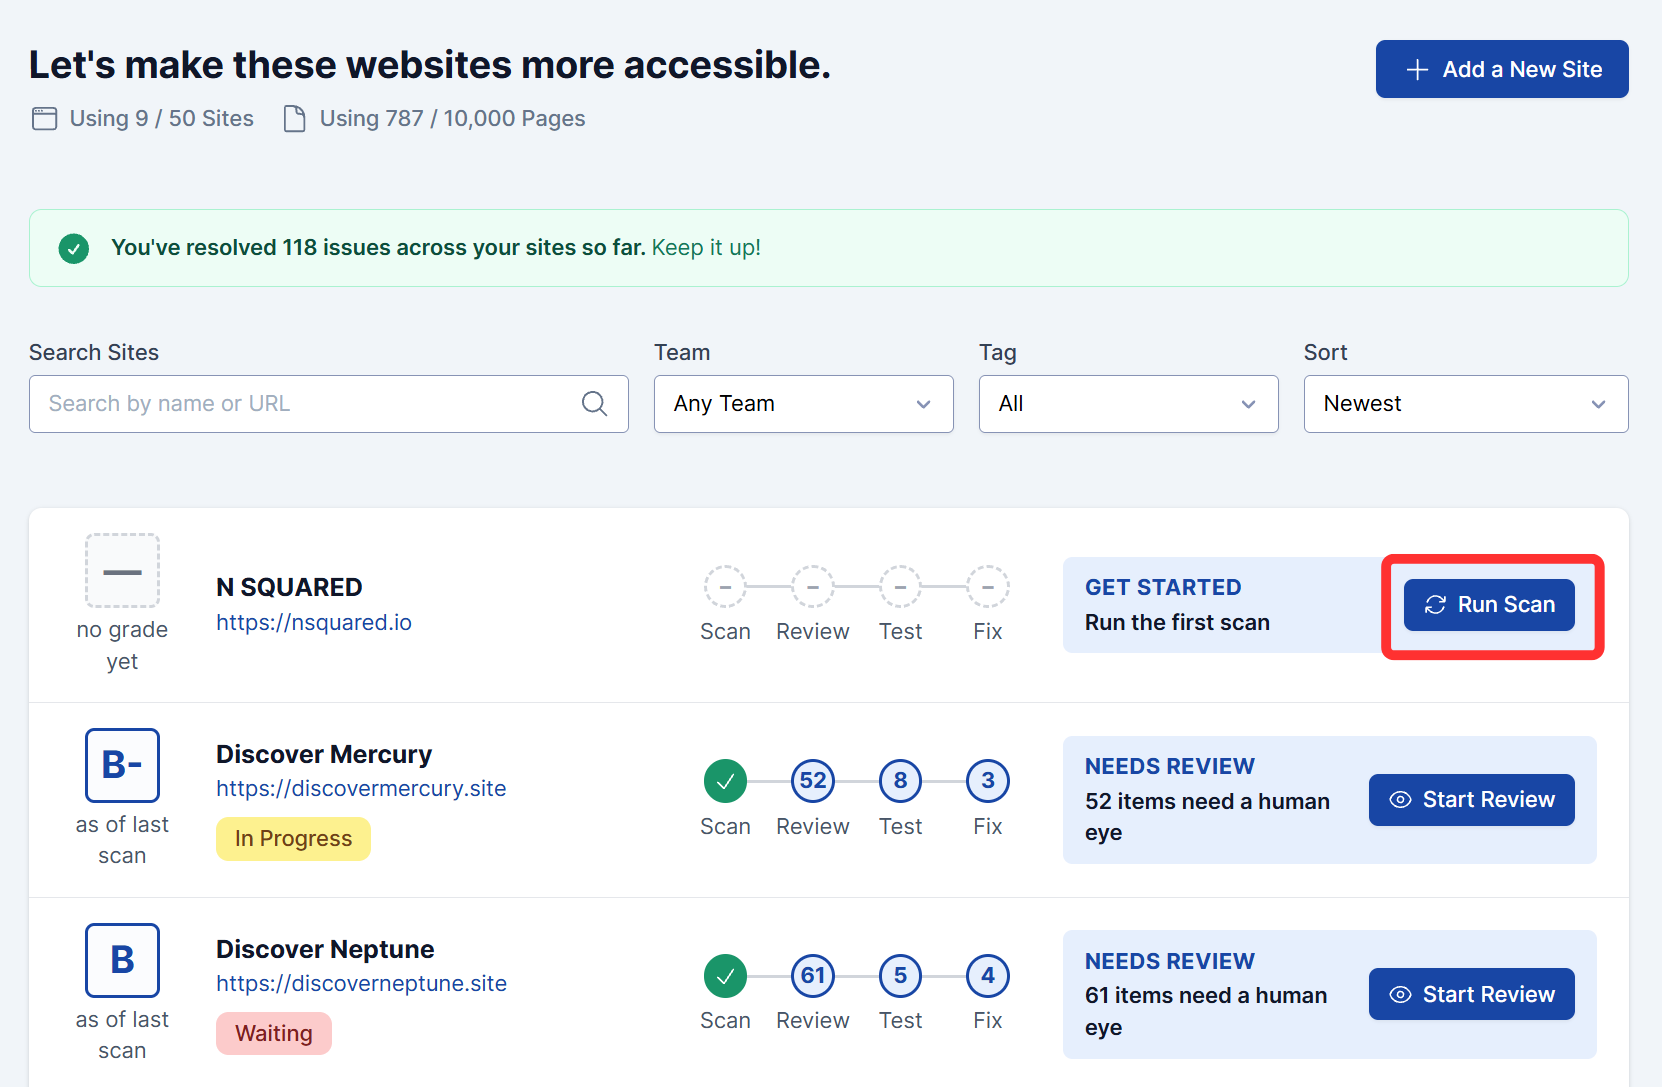
For a site that hasn’t been scanned yet, or one that’s sitting idle, you can start an automated scan straight from its row using the Run Scan button in the next step box, without opening the Site Dashboard first. You’ll get a “Scan started” confirmation and stay on the list. If the site is already busy, for example finishing another scan or importing a sitemap, the message tells you that instead. While a scan is running, the list refreshes itself every few seconds so the Scan step, the Review count, and the site’s group placement update on their own.
On the left, under Sites, the sidebar lists every site in the workspace. Click a site name to expand its menu and reach its Site Dashboard and the other site screens. The workspace-wide settings pages aren’t in this sidebar; open Manage Workspace from the account dropdown to reach them.
Clicking a site name in the sidebar (or a site row on the Workspace Dashboard) opens that site’s own menu: Site Dashboard, Trend Report, Visual Mode, Issues, Needs confirmation, Review fixes, Pages, Teams, Settings, and Integrations. Some of these stay hidden until the site’s first scan. Each one is covered below.
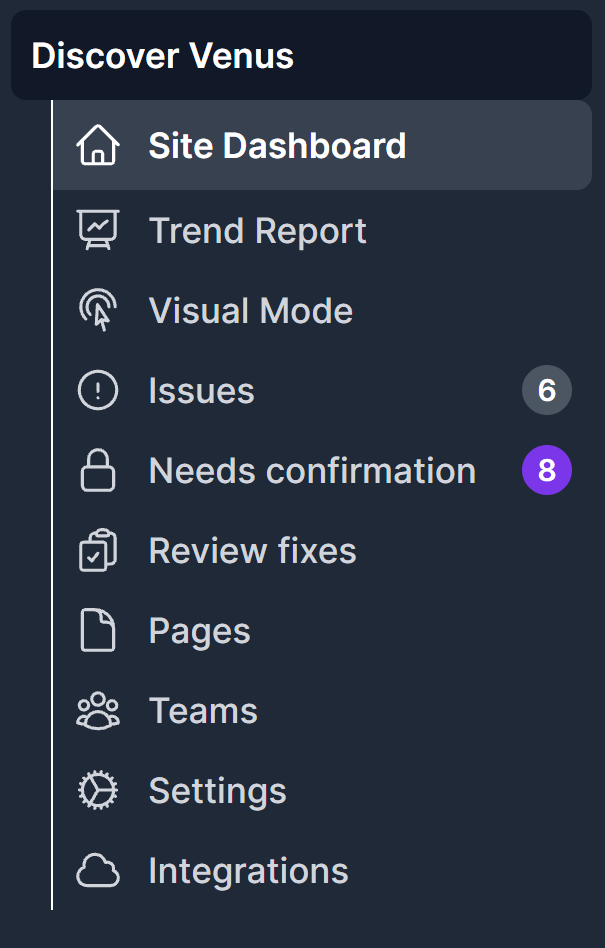
Site Dashboard
The Site Dashboard is the home screen for a single site. It shows the site’s setup, its Accessibility Score, where it stands in the testing workflow, its statistics, and its recent activity, all on one page.
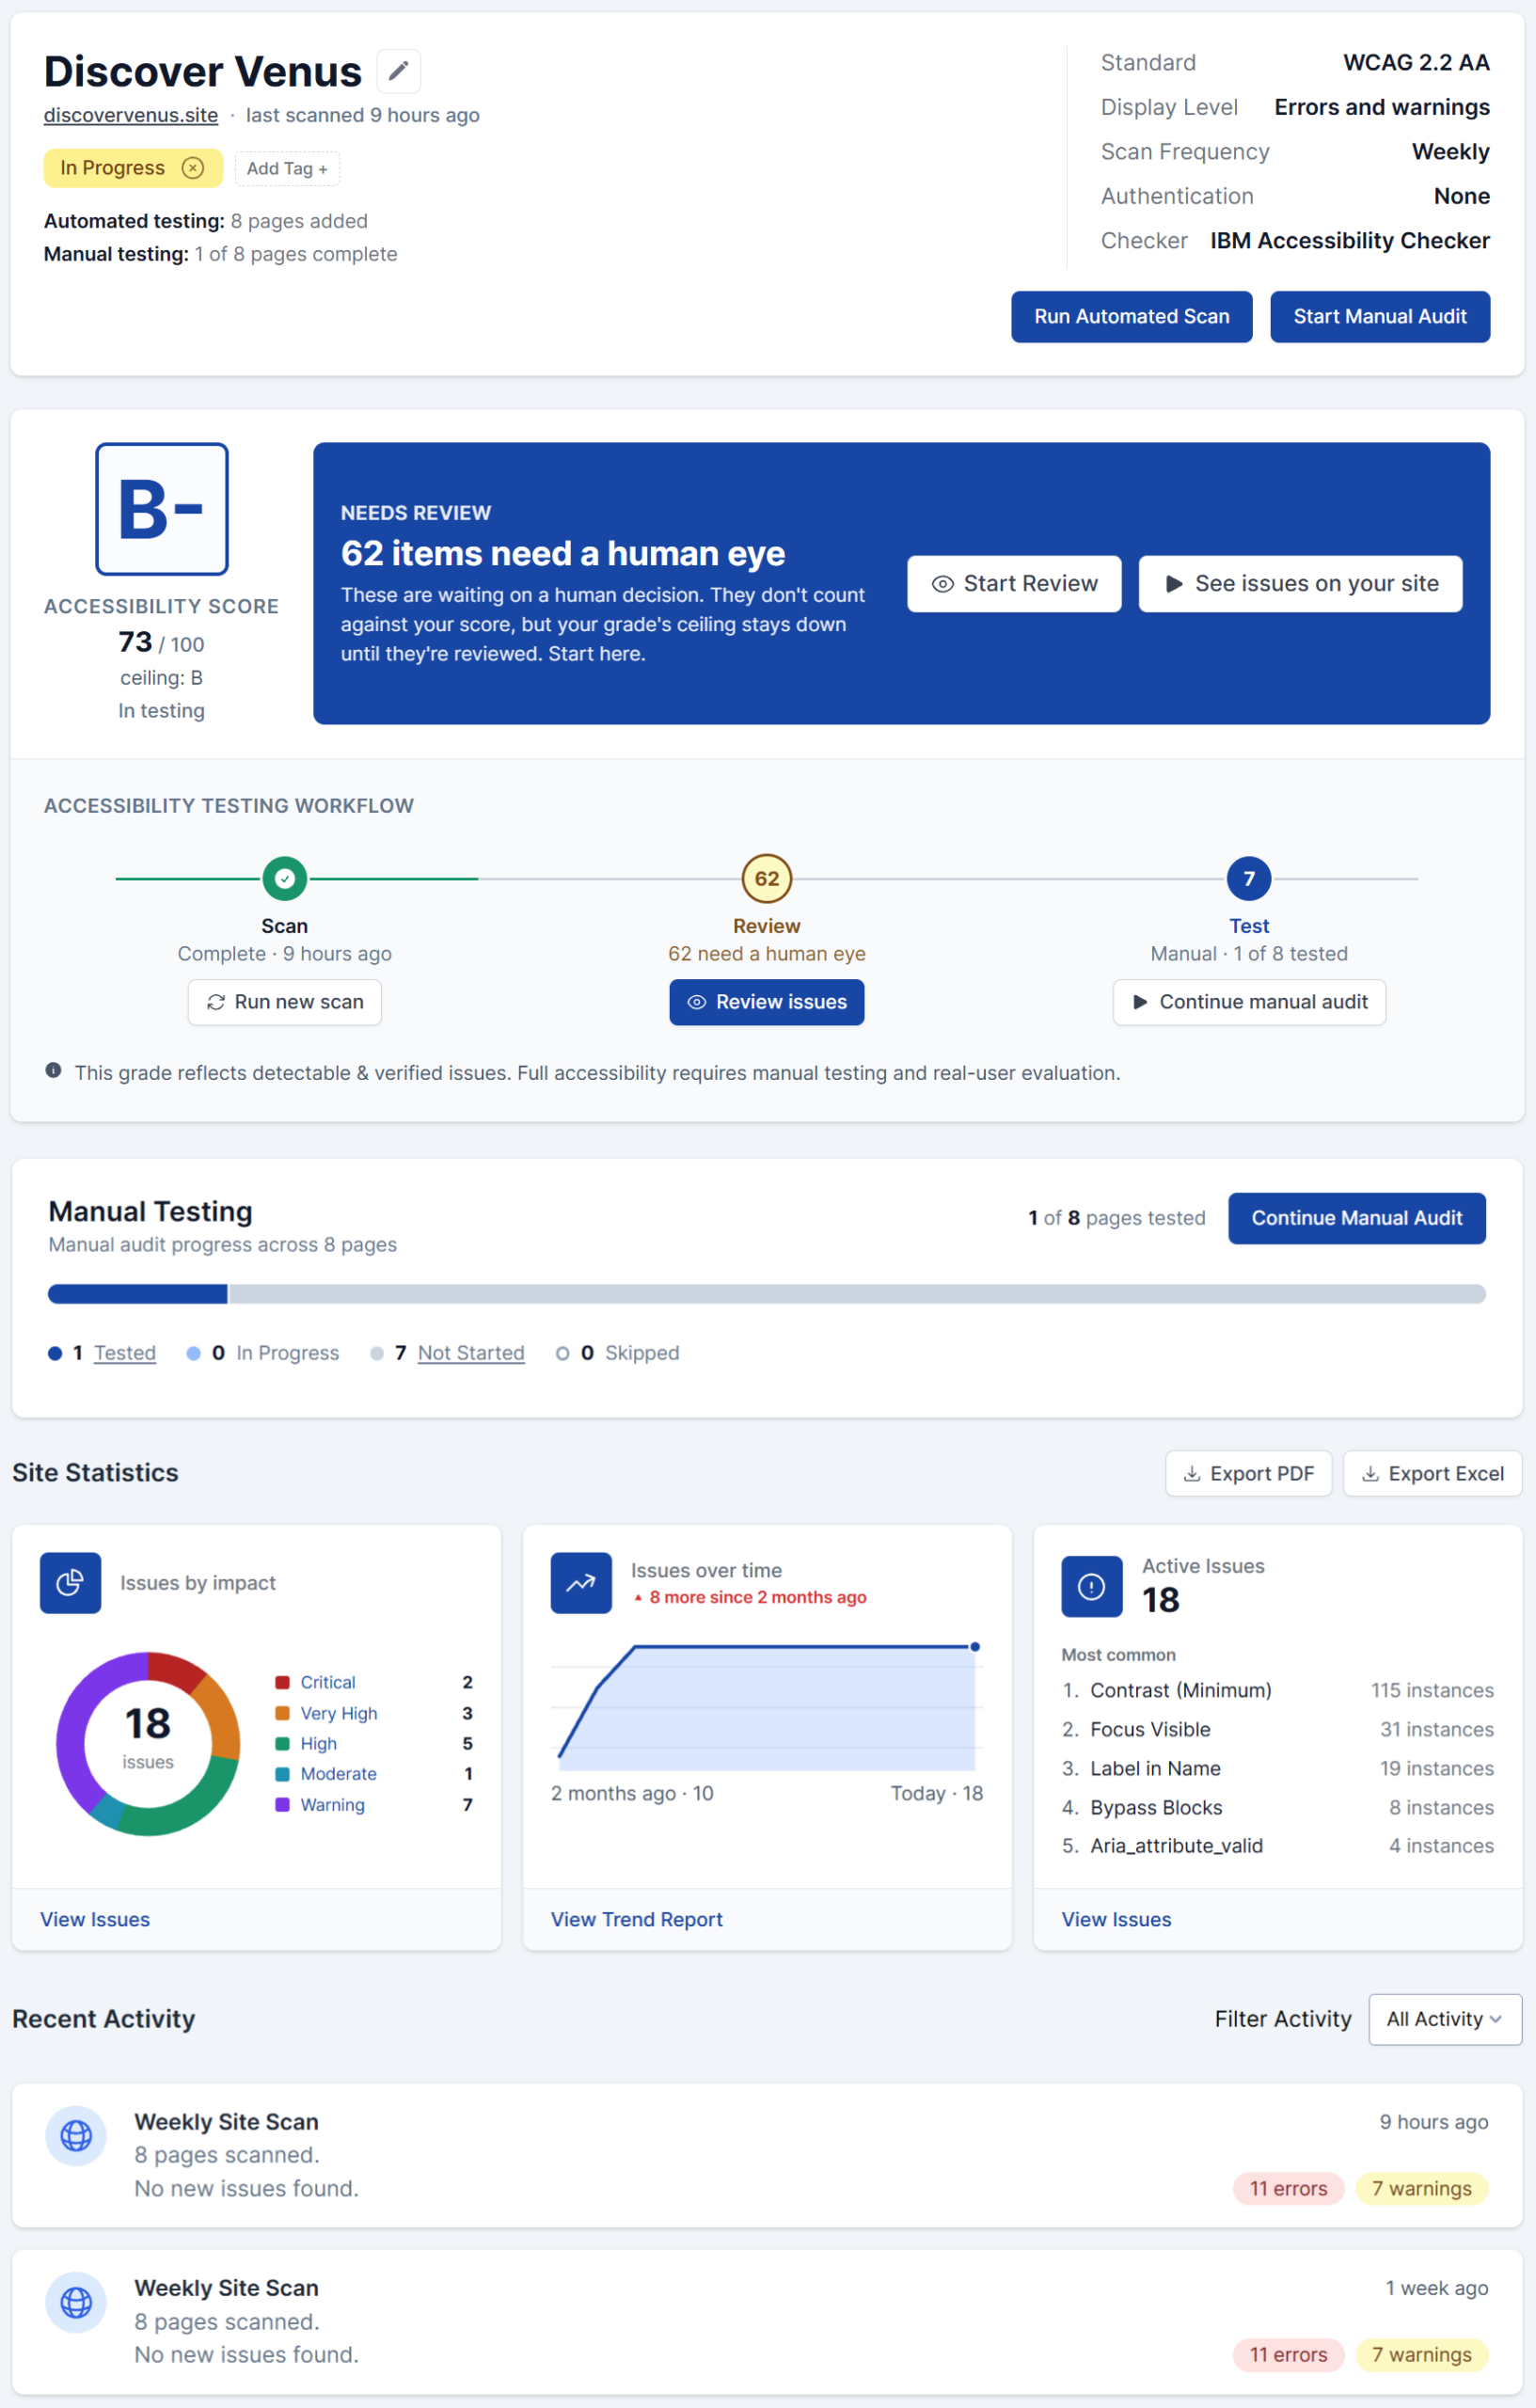
The site header
The card at the top shows the site name (click the pencil to rename it), the site URL, and when it was last scanned, along with any site tags and an Add Tag button. Below that, a quick read on progress: how many pages are added for automated testing, and how many pages are complete for manual testing.
On the right, the site’s current configuration is summarized: Standard, Display Level, Scan Frequency, Authentication, and Checker. Change any of these from the Settings screen. Run Automated Scan and Start Manual Audit buttons sit here too.
Accessibility Score
The score card shows your site’s current Accessibility Score out of 100 with its letter grade, a ceiling (the best grade the score can reach until manual testing and review are done), and a note such as “Automated only” describing what the score currently reflects.
Next to it, a highlighted panel calls out the single most useful next step for the site. For example, when instances are waiting on review it reads “N items need a human eye” and explains that they don’t count against your score, but your grade’s ceiling stays down until they’re reviewed, with Start Review and See issues on your site buttons. As on the Workspace Dashboard, what this panel suggests depends on your role, so it won’t prompt you to run a scan or start an audit if your role can’t.
Accessibility Testing Workflow
A Scan → Review → Test track shows where the site is in the testing workflow. Each step shows its status (for example “Complete · 8 hours ago”, “52 need a human eye”, “Manual · 0 of 8 tested”) and a button to act on it: Run new scan, Review issues, or Continue manual audit. A line below the track is a reminder that the grade reflects detectable and verified issues, and that full accessibility also needs manual testing and real-user evaluation.
Manual Testing
This card tracks your manual audit across the site’s pages: a progress bar, plus counts for Tested, In Progress, Not Started, and Skipped. Click any count to jump straight to that filtered subset of the Pages list.
The button changes with your progress: Start Manual Audit if nothing’s been tested yet, Continue Manual Audit once some pages are tested or skipped but not all, or Review Manual Audit once every page is Tested or Skipped. It opens Visual Mode to do the testing.

See Manual Testing Workflow for the full walkthrough.
Site Statistics
Three cards summarize the site’s issues:
- Issues by impact: a donut breaking your issues down by impact (Critical, Very High, High, Warning).
- Issues over time: how your issue count has moved (for example “6 fewer since 2 months ago”), with a link to the full Trend Report.
- Active Issues: the current count, with the most common issue types and how many instances each has.
Each card links through to the Issues list. Export PDF and Export Excel at the top of this section download a full report of the scan results.
Recent Activity
A feed of everything that has happened on the site: scans run, issues and instances updated, comments added. Each scan entry shows how many pages were scanned and its error and warning counts. Use the Filter Activity dropdown (set to All Activity by default) to narrow the feed down.
Trend Report
The Trend Report is the site’s score-history screen, which charts your Accessibility Score against its grade ceiling over time. Open it from Trend Report in the site menu, or from the View Trend Report link on the Site Dashboard’s Issues over time card.
See the Trend Report guide.
Visual Mode
Visual Mode opens the site in your browser through the AAArdvark extension so you can see exactly where each issue sits on the page and record manual issues as you go. It’s also where manual testing happens.
Learn more in the Visual Mode guide.
Issues
Issues will lead you to a listing of issues found on your site due to scans or manual audits. Explore all of the issues identified on your site, sorted by:
- Severity: Critical to low impact
- Type: Errors, warnings, or notices
- Status: Active, pending, resolved, or not an issue
- Pages: Specific locations of the issues
- Assignees: Team members handling the resolution
The Issues menu item will remain hidden until a scan has been run for the first time. Once a scan has been run, Issues can be accessed for the site.
The Site Statistics section also presents an overview of the site’s issues, including an Issues over time chart.
Learn more about accessibility issues by taking a peek at this guide.
Needs confirmation
Needs confirmation is a separate screen from the main Issues list. It gathers every issue that has instances the scanner flagged for a manual check, and shows how many instances need review on each. A reviewer checks each one and either Confirms it as a real issue or Dismisses it.
Learn more in Understanding the Accessibility Testing Workflow and Fix and Manage Issues.
Review fixes
Review fixes gathers manually-recorded issues that have been marked fixed and submitted for review, waiting on a reviewer to confirm the fix since a scan can’t verify it. Owners, Administrators, Project Managers, and Accessibility Testers can review these.
Learn more in Fix and Manage Issues.
Pages
Your Pages can be added to the site, allowing you to run an automated scan or start a manual audit. The Pages will also let you access the settings and issues for the pages in particular.
The Pages menu item will display as Homepage Settings if the site is on the Homepage plan of AAArdvark until it’s upgraded.
Learn more about adding pages to a site with the help of this guide.
Teams
If you need to assign teams to particular sites, you can do so from here. This will let you grant access to non-admins and non-project managers so they can view the site dashboard.
Settings
When you set up your site for the first time in AAArdvark, you remember seeing a site configuration screen. From the settings of the site dashboard, you’re able to make changes to the configuration.
If you haven’t already done so, configure a site today by following the steps here.
Integrations
The Integrations page will lead you to all of the integrations you have enabled for the site, or the ability to add any if there are none.
The Integrations menu item will remain hidden until a scan has been run for the first time.
Take a peek at the integrations we offer.
Notifications
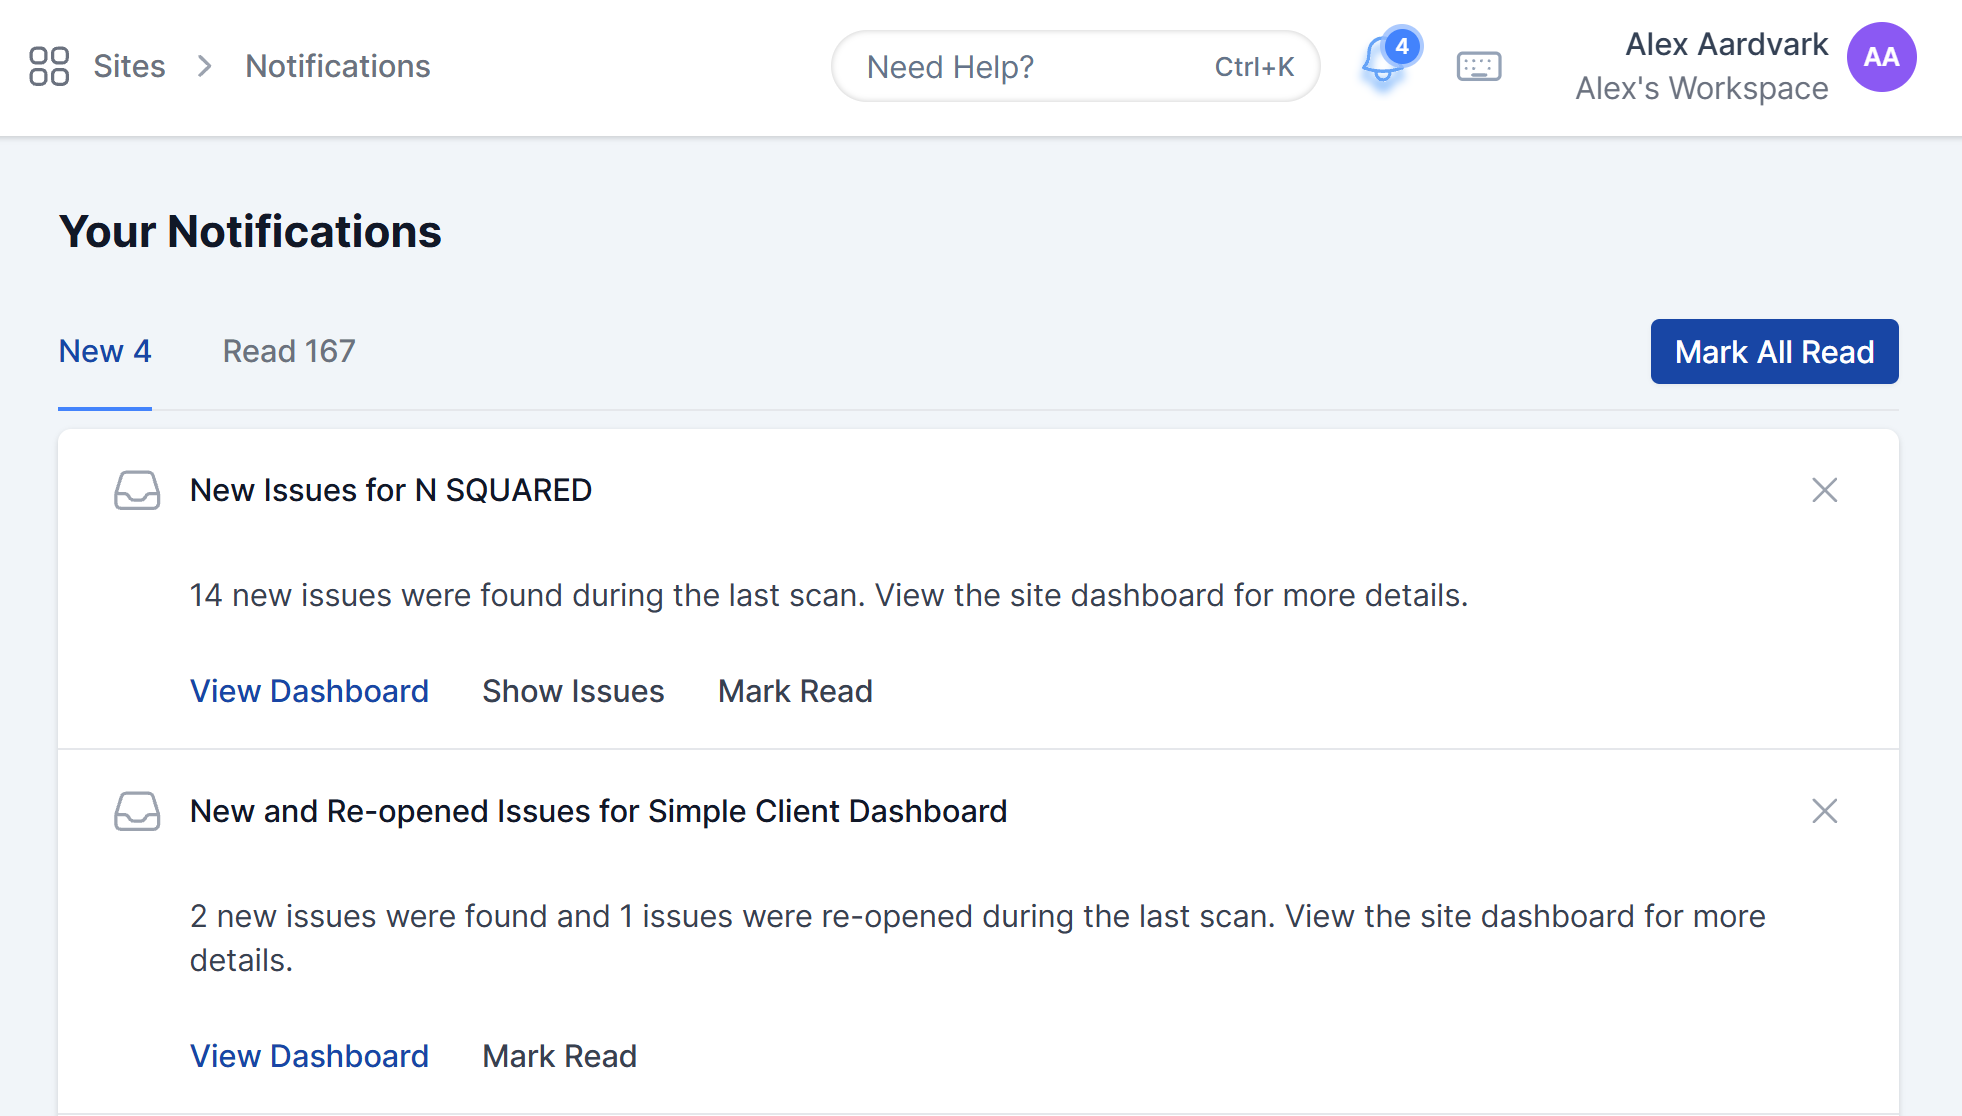
The Notifications bell icon in the upper-right corner of your dashboard alerts you to new issues assigned during scans.
Click the bell to:
- View new notifications
- Mark issues as read or dismiss them
- Revisit read notifications for reference later
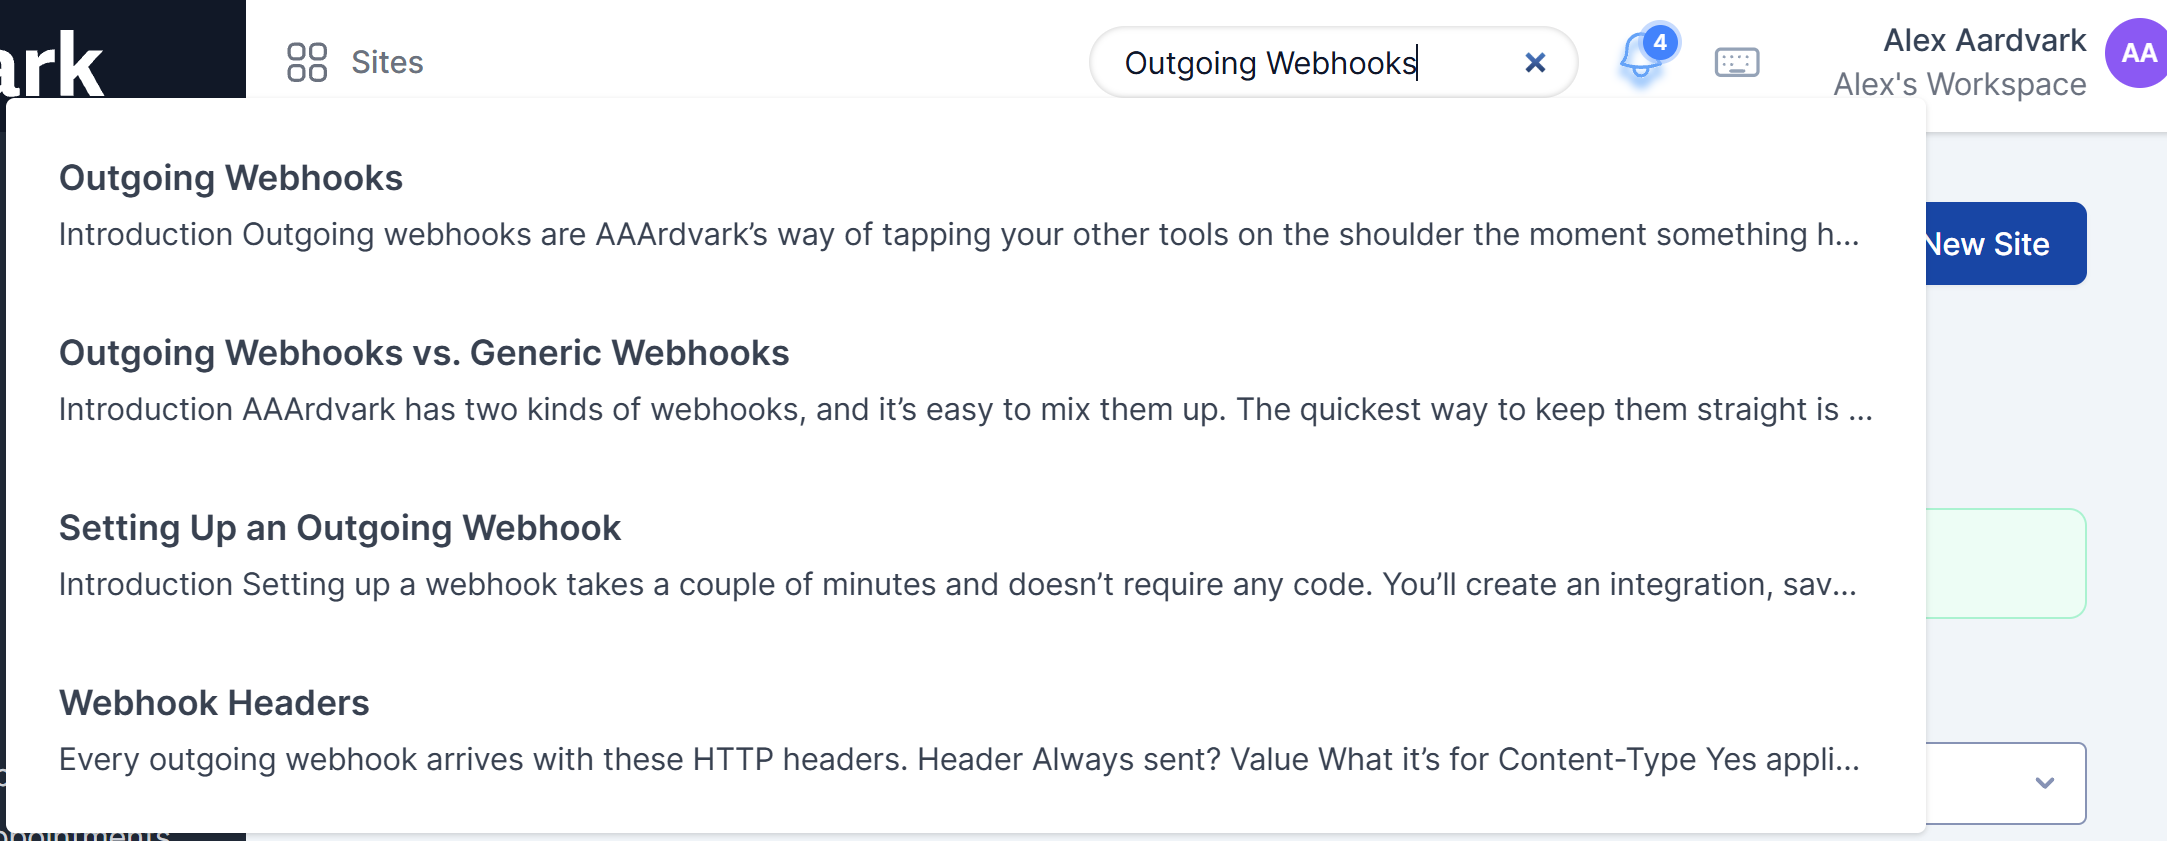
Search the Help Center
Running into issues or have a question about how something is set up? The nifty search bar can be used to enter search terms and bring up relevant guides from our help center that address the topic at hand.
Please also consider visiting the rest of our help center here.
Keyboard Shortcuts
The keyboard icon in the top bar, next to the notifications bell, opens the keyboard shortcuts dialog. It lists every shortcut available in AAArdvark and lets you remap or disable them. You can also open it anytime by pressing ?.
See Keyboard Shortcuts for the full list.