Find Elements with Instance Snippets
Introduction
After running a site scan, you might need a quick way to locate the specific element causing an accessibility issue. With AAArdvark, you can use JavaScript snippets to find the affected element directly on your website.
Get the Snippet
- Locate the Issue: Go to the Issues tab and select the issue you want to inspect. Ensure it is marked as Active.
- Expand Details: Scroll down to the section displaying either a screenshot or code. Look for the Show Snippet link and click it.
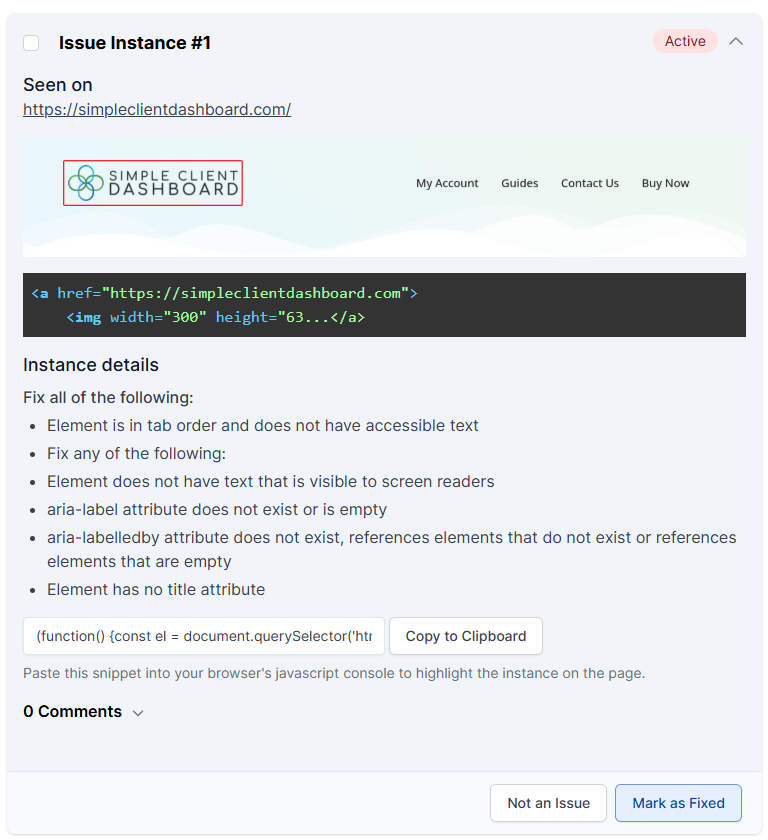
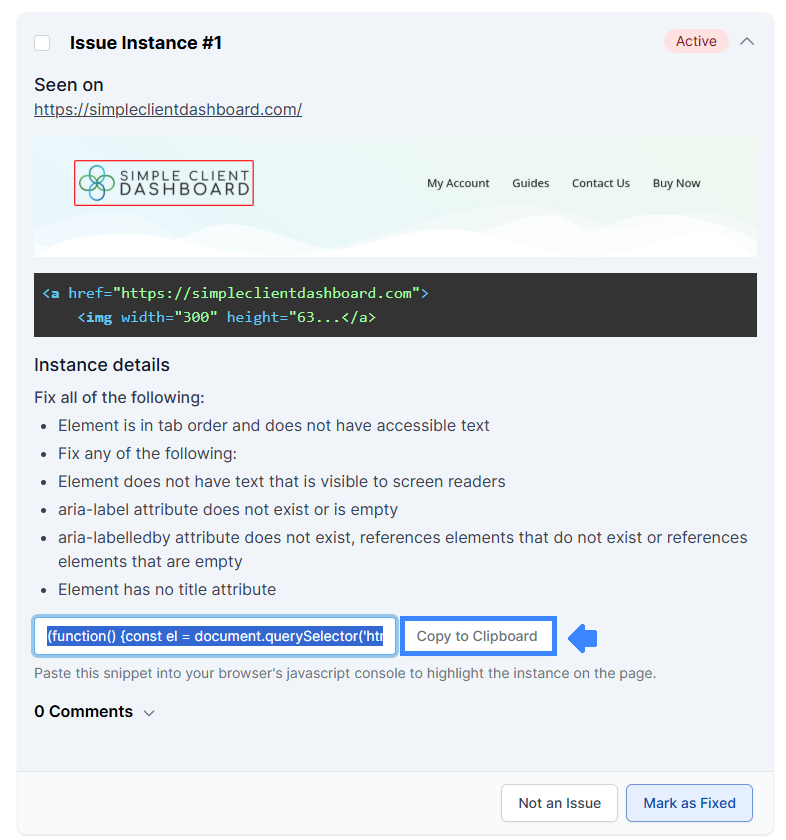
- Copy the Snippet: A JavaScript snippet will appear in a code box. Click Copy to Clipboard to copy the code.
Using the Snippet
You’ll use the snippet in a separate browser window where you’re viewing the page of your website where the accessibility issue is happening. You’ll use the browser console to locate the element.
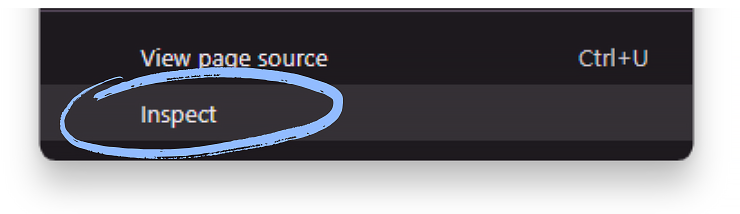
- Open the Browser Console: Right-click anywhere on the affected page and choose Inspect (or the equivalent option in your browser).
- Navigate to the Console Tab: In the developer tools, switch to the Console tab.
- Paste the Snippet: Paste the copied JavaScript snippet into the console and press Enter.
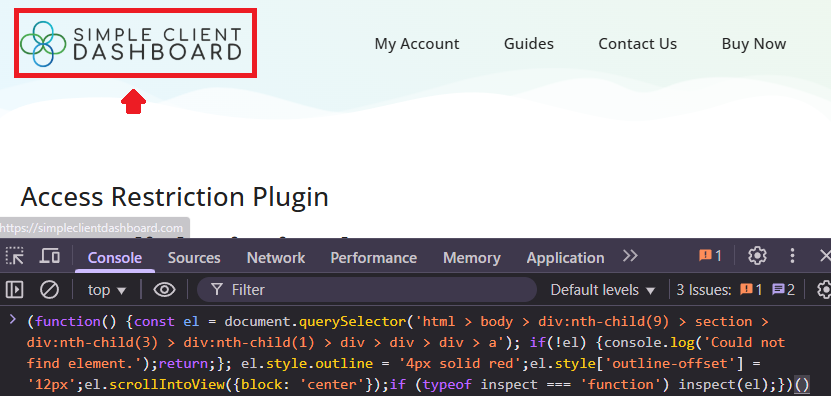
- View the Highlighted Element: The affected element will be outlined in red on your page.
Tip: If your browser prompts you to confirm running scripts, follow the instructions to proceed safely.