Exporting Reports
Introduction
AAArdvark’s reporting feature makes it easy to review and share accessibility scan details for your site. Reports are available as PDF or xlsx (spreadsheet) files, providing summaries of scan results, issues, and WCAG compliance.
AAArdvark’s reports are tailored to meet your needs. Choose a PDF report for a concise visual summary or choose an xlsx report for detailed, sortable data.
Running a Scan
Before generating a report, make sure to run an automated scan. Once the scan is complete, report download options will appear in your Site Dashboard.
Downloading the Report
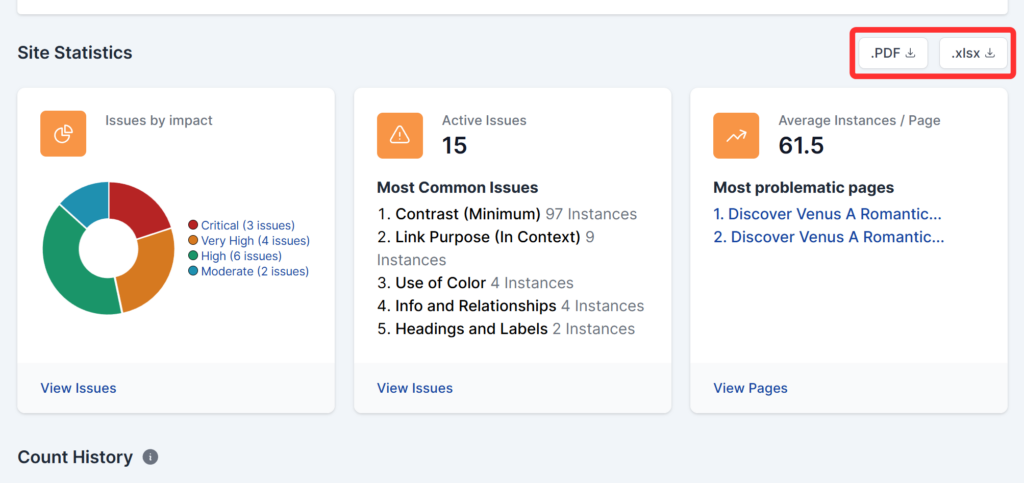
To download a report, go to the Site Dashboard and find the PDF and xlsx buttons below the site’s information. Click the button for your preferred format. Once the report is ready, the button will change to say, ‘PDF/Excel file is ready to download.’ Simply click again to download the file.
Information Included Within Reports
The information included in the reporting features varies depending on which file was downloaded.
PDF File Report
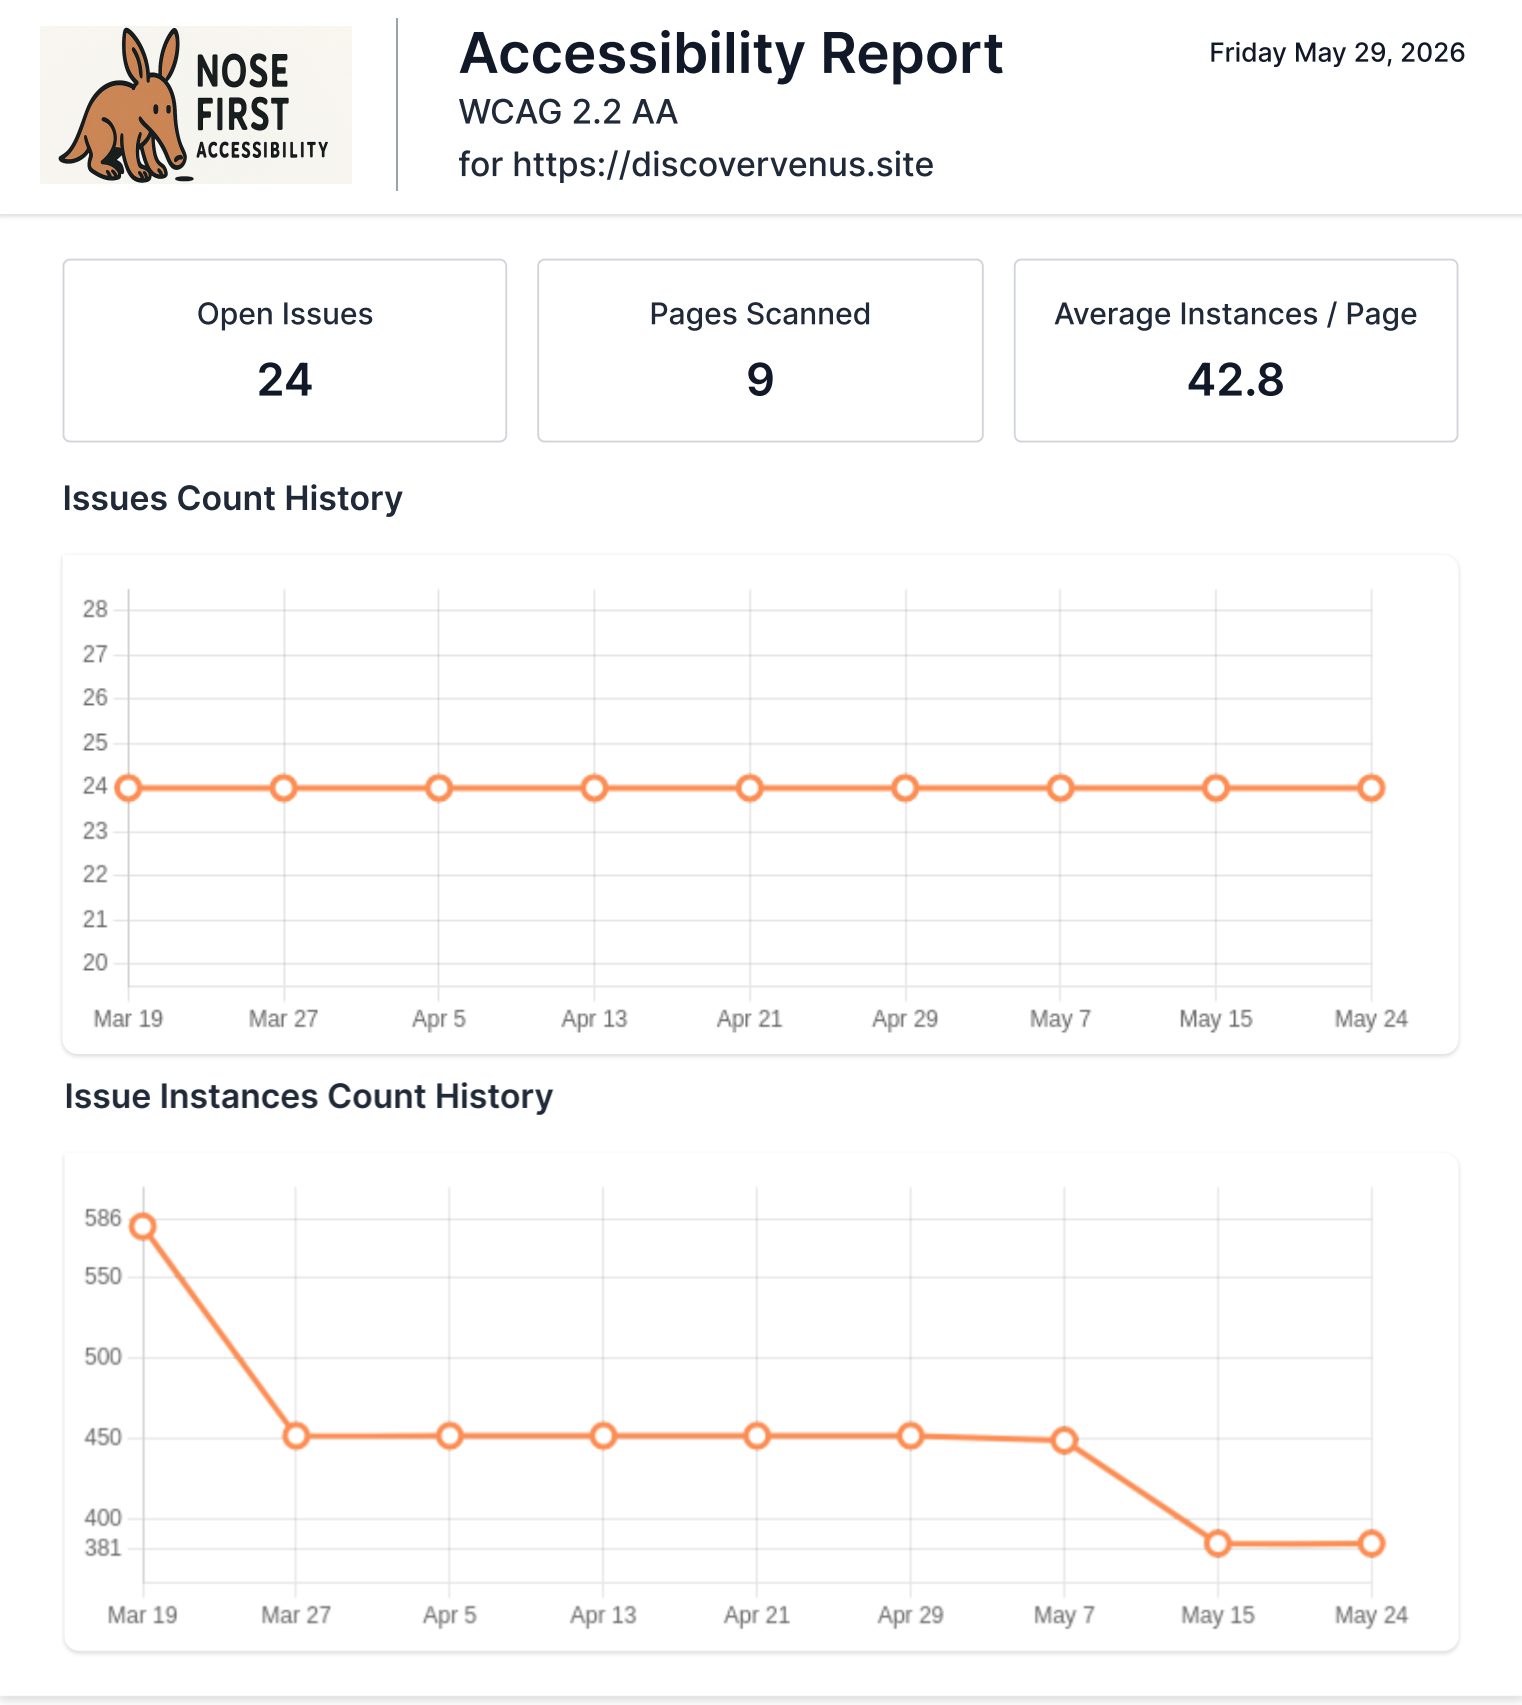
The PDF report provides a clear summary of your site’s accessibility status. It includes a summary overview, issue count history, top priority issues, and top problematic pages.
Summary Overview
A quick summary of Open Issues, Pages Scanned, and Average Instances / Page.
Issues and Instances Count History
- A graph showing the history of issue counts
- A graph showing the history of the issue instances count
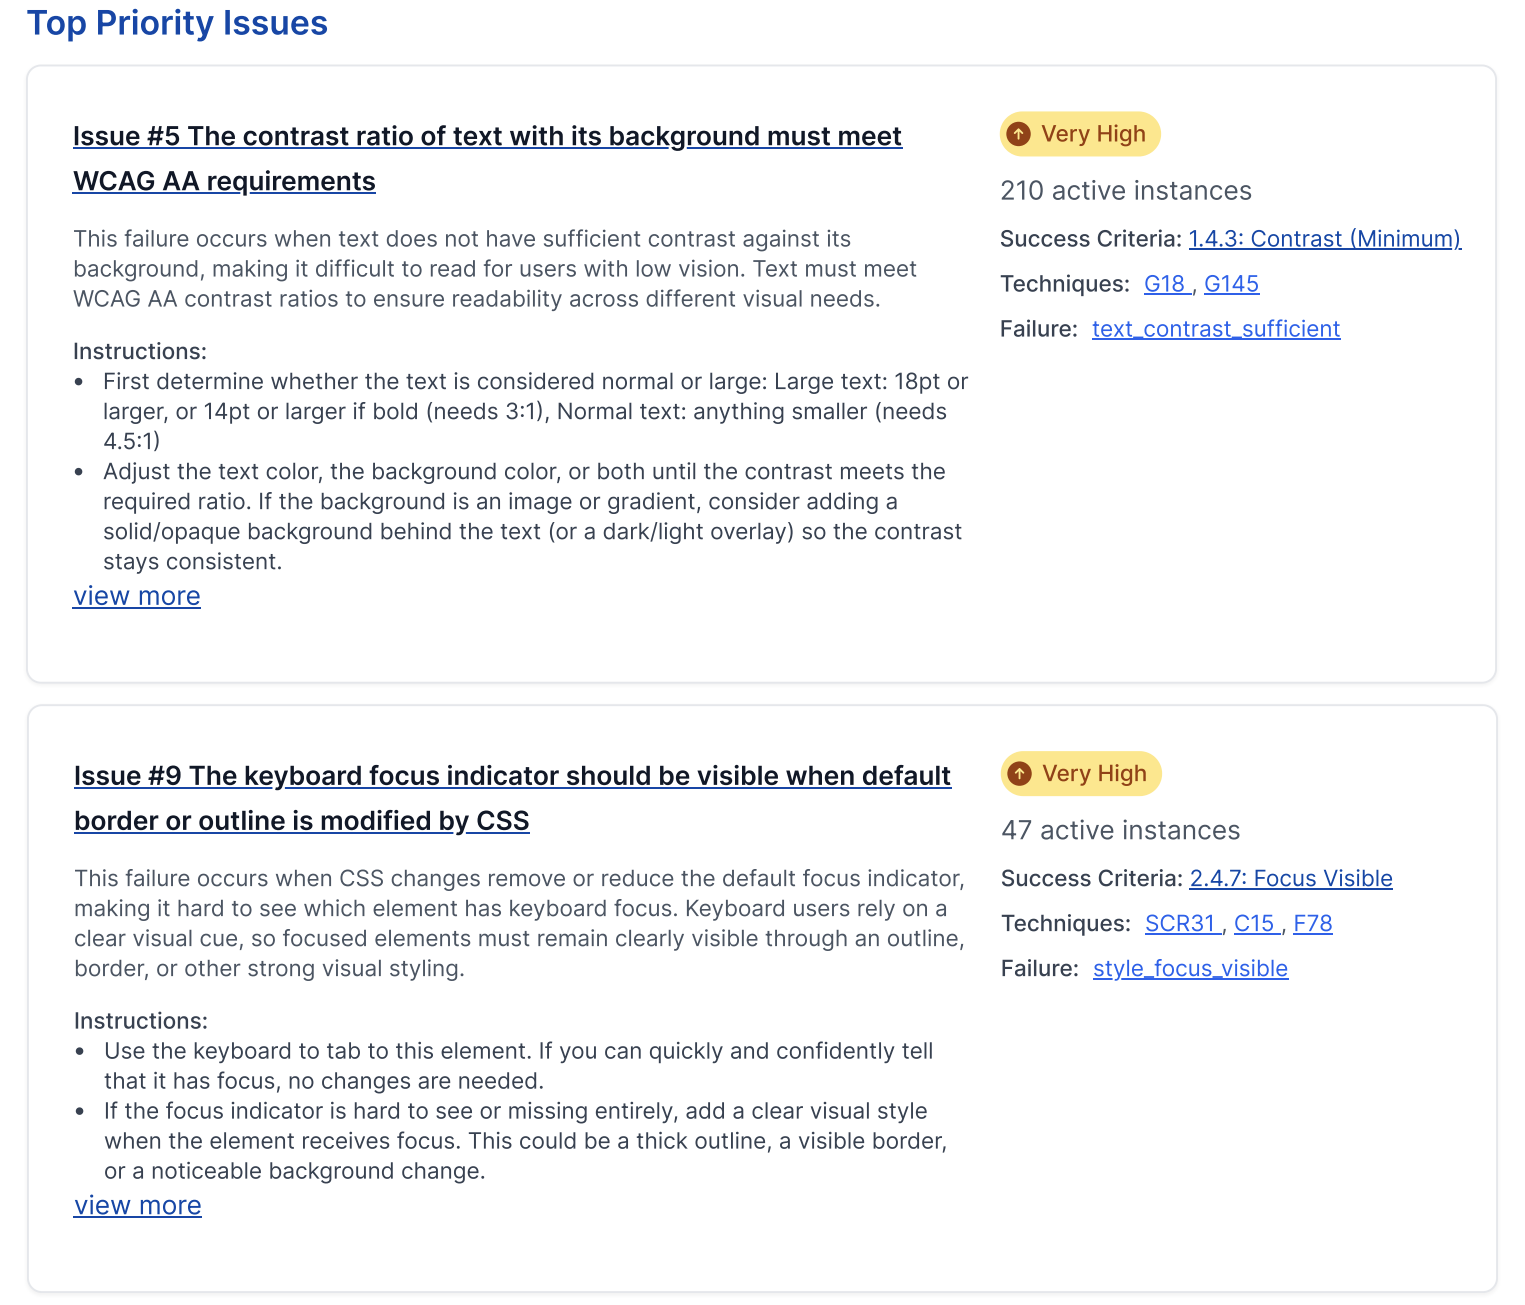
Top Priority Issues
A list of Top Priority Issues, each showing the WCAG failure description below the issue title for additional context.
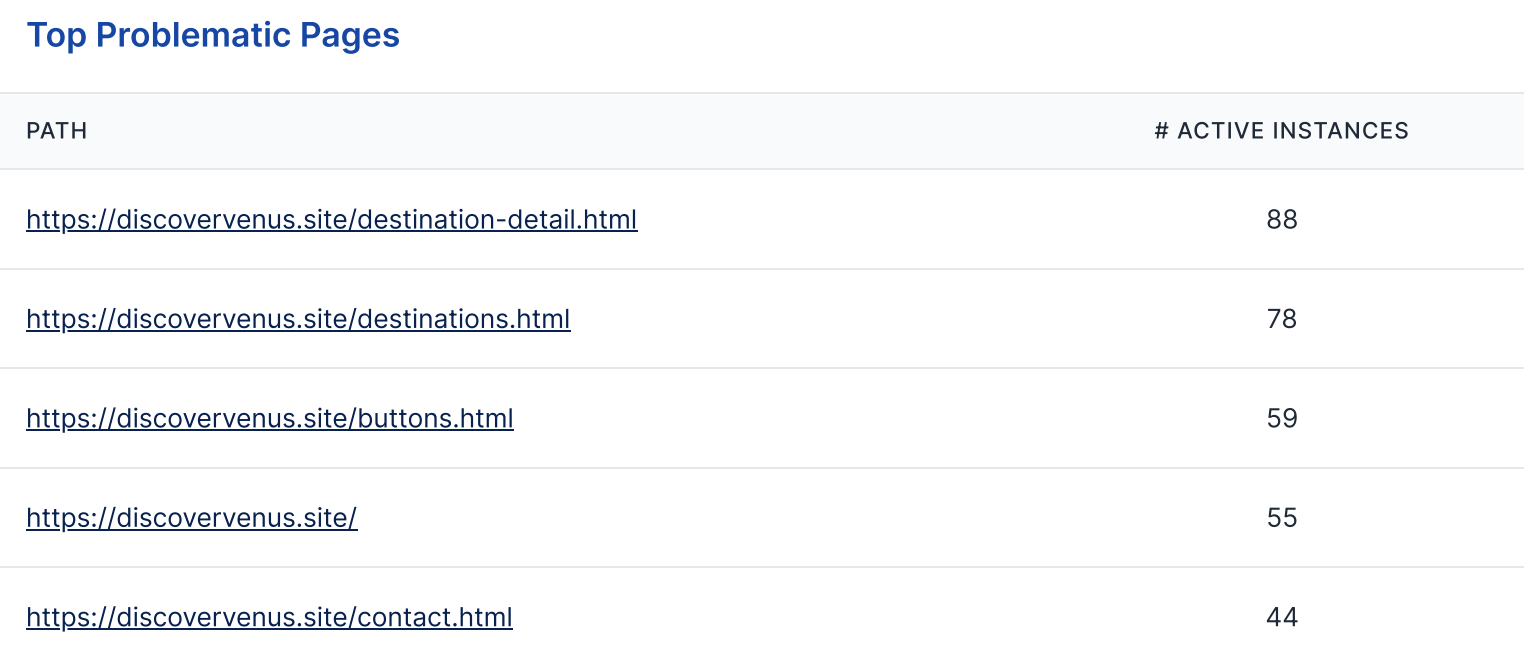
Top Problematic Pages
A list of Top Problematic pages.
xlsx Report File
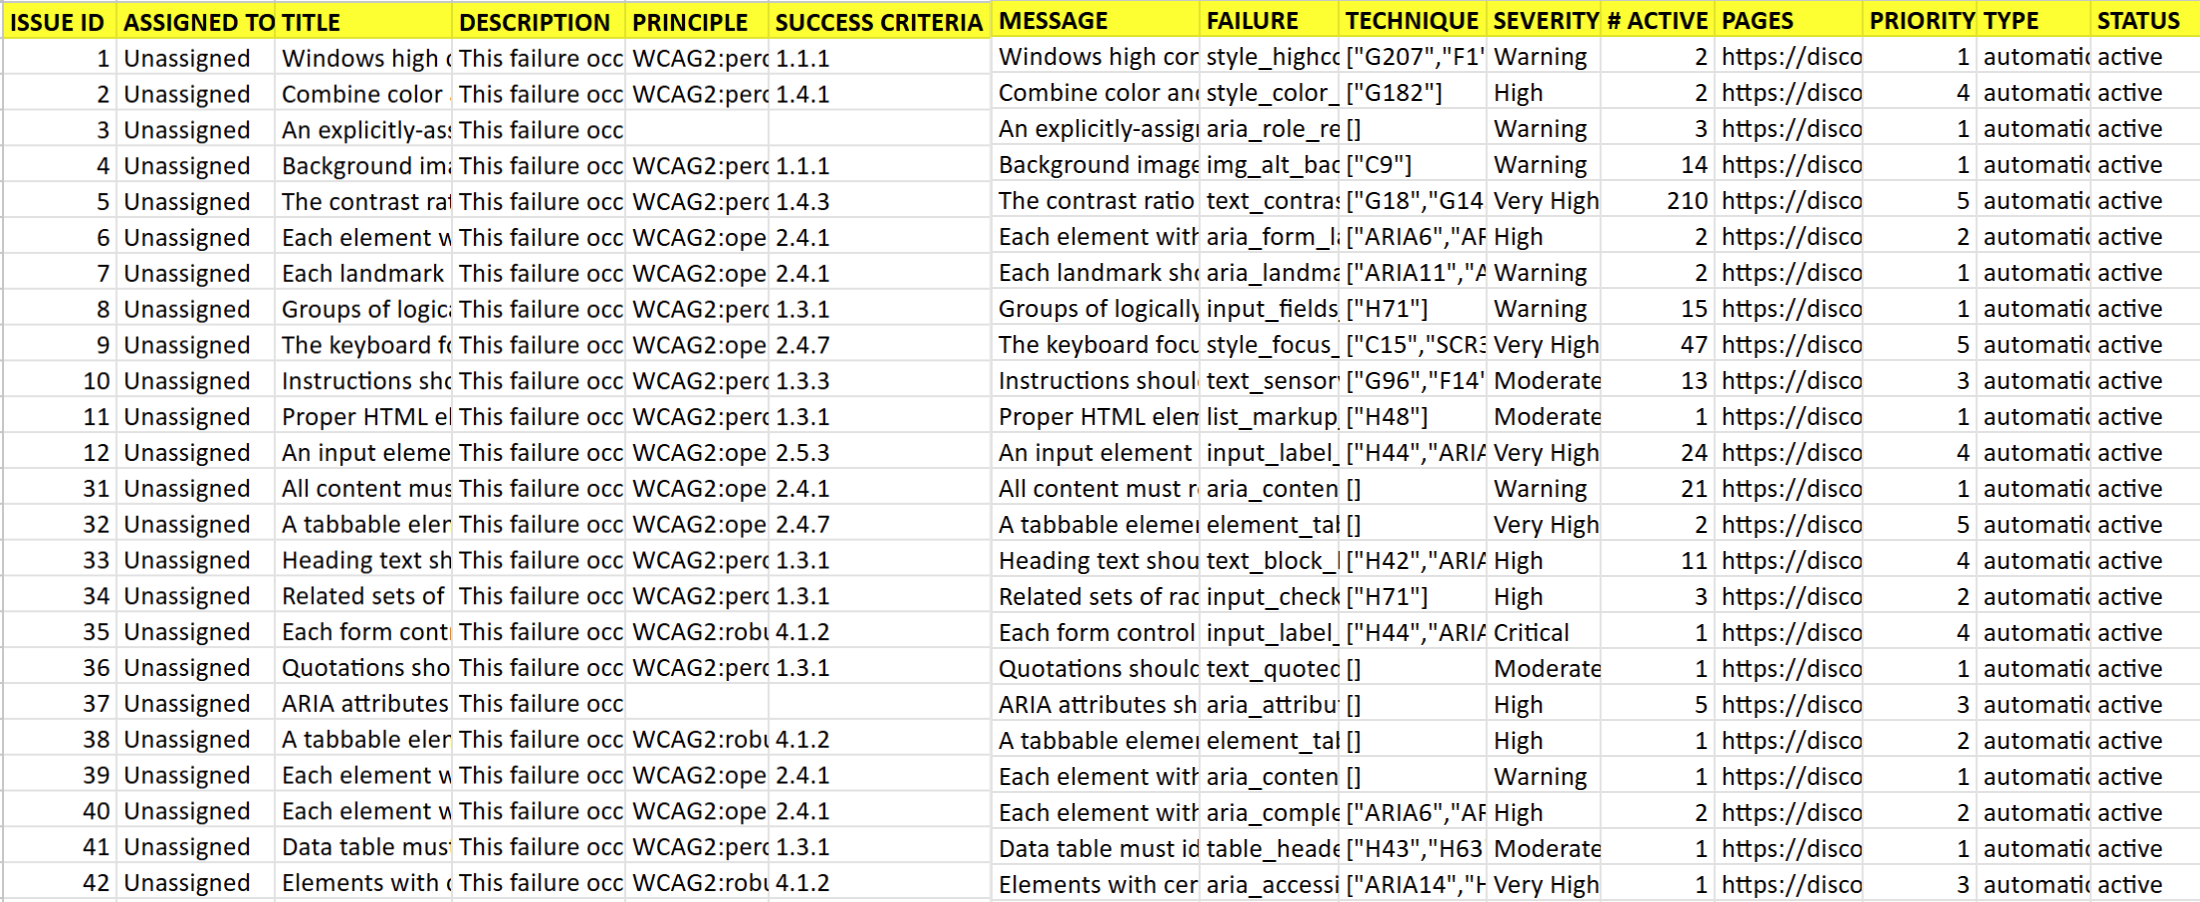
The xlsx report provides detailed, sortable data to help you manage accessibility issues efficiently. It includes:
- Issue ID and assigned team member
- Title (the WCAG failure title for the issue, or the issue message when no failure is linked) and description (the WCAG failure description)
- WCAG level and associated principle
- Success criteria, failure, and recommended solutions/techniques
- Severity level, number of active instances, full page URLs, and priority level
- Source of the issue (automated scan or manual audit)
- Issue status (active or resolved)