Exporting Reports
Introduction
AAArdvark’s reporting feature makes it easy to review and share accessibility scan details for your site. Reports are available as PDF or xlsx (spreadsheet) files, providing summaries of scan results, issues, and WCAG compliance.
AAArdvark’s reports are tailored to meet your needs. Choose a PDF report for a concise visual summary or choose an xlsx report for detailed, sortable data.
If you’ve set up Report Branding in your Workspace Settings, the PDF report uses your business name, logo, header color, and footer details, and drops AAArdvark’s own branding.
Running a Scan
Before generating a report, make sure to run an automated scan. Once the scan is complete, report download options will appear in your Site Dashboard.
Downloading the Report
Go to the Site Dashboard and find the Export PDF and Export Excel buttons below the site’s information. Click the button for your preferred format.
While the file generates, the button reads “Preparing PDF” or “Preparing Excel.” Generation runs in the background, so you can keep working while you wait. If generation fails or takes unusually long, you’ll see an error message on the dashboard and can try again.
When the file is ready, the button splits in two: click Download PDF (or Download Excel) to save the file, or the Regenerate icon beside it to build a fresh copy from your latest scan. Regenerating never leaves you without a file – your current report stays available to download while the new one is being built.
Once a report is ready, it stays ready: if you leave the Site Dashboard and come back later, you can still download it without generating it again.

Information Included Within Reports
The information included in the report varies depending on which file you download.
PDF File Report
The PDF report is a branded, multi-page summary of your site’s accessibility status. It pulls in your Accessibility Score, your progress over time, and a prioritized, plain-language list of what to fix next.
Cover Page
The header reads “Accessibility Report” with the date it was generated. If your workspace has Report Branding set up, your logo and business name replace AAArdvark’s own branding here and throughout the report.
Below that:
- Site details: the site’s name and URL, the WCAG standard it’s tested against, how many pages were scanned, and when the last scan ran.
- Accessibility Score: your letter grade in a box, the 0-100 score beneath it, and a short explanation of what’s holding the grade at its current ceiling – for example, “A grade of C – ceiling capped at B.” A line underneath makes clear the score reflects detectable, verified issues and is a measure of progress, not a compliance claim.
- Testing coverage, three cards showing what feeds the grade:
- Automated scan – whether the latest scan is complete, and how many confirmed issues it found.
- Needs review – how many manually-flagged issues are still awaiting a human decision. These don’t count against the score while they wait, but they hold the grade’s ceiling down until each one is confirmed or dismissed.
- Manual testing – how many of the planned pages have been tested so far, including any skipped. Even once testing is complete, any open Critical issues still block the top grade.
- A short stat row: Open Issues, Critical Issues, Pages Scanned, and Scan Frequency.
- An “In This Report” list linking to the report’s remaining sections: How Your Grade Is Calculated, Open Issues by Severity, Progress Over the Last 90 Days, Recommended Next Steps, and Top Priority Issues to Fix.
- A disclaimer: “This report reflects detectable, verified issues found by automated scanning (ACE, aXe, HTMLCS). Full accessibility also requires manual testing and real-user evaluation – it does not certify WCAG compliance.”
Every page of the report, not just the cover, ends with a footer showing your Report Branding footer text and website (or AAArdvark’s own, if you haven’t set up branding) alongside the page number.

How Your Grade Is Calculated
A one-page explanation of the four rules behind your score, so the grade is never a black box:
- Coverage sets the ceiling – automated scanning alone can earn at most a B, since it’s short of a full audit by design and signals the process is incomplete. Completing manual testing lifts the ceiling into the A range, and the grade then reflects what that testing finds.
- Potential issues cap the grade until reviewed – items flagged for human review never subtract points on their own, since an unconfirmed finding is a question, not a failure. But while any are waiting, the grade’s ceiling stays held down, and it only rises as your team confirms or dismisses each one.
- Critical issues hold back the top tier – however much testing is done, a site can’t pass B while a confirmed Critical issue is still open. The most severe barriers have to be cleared before the top grades are available.
- Weighted by real-world impact – higher-severity confirmed issues weigh more, and counts are normalized per page so a single dense page can’t dominate the score. Checks that don’t apply to a page are never counted as a “pass,” so the score is never inflated for untested ground.
A callout beneath the four rules reinforces the point: “Progress, never compliance. Even an A means strong progress – it is never a guarantee of conformance or a substitute for testing with real assistive-technology users.”

Open Issues by Severity
A donut chart and bar list breaking your open issues into five severity levels – Critical, Very High, High, Moderate, and Low – using the same colors as the app. A note beneath makes clear severity is risk-graded, not a red-to-green ramp: Critical issues should always be remediated first, regardless of how many lower-severity issues there are.

Progress Over the Last 90 Days
A trends page showing how your site is moving, measured against the current scan-engine version:
- Delta cards for the change in score, the change in open issues, and the number of instances fixed over the window.
- An Accessibility score trajectory line chart, plotting your score week by week and labeled with the start-to-end change and your current ceiling (for example, “73 → 65 · ceiling B”). The axis zooms into the relevant score range rather than showing the full 0-100 scale.
- An Open issues over time chart, tracking confirmed open issues at each weekly scan across every severity – so this total can run higher than the counts in the severity breakdown.
A closing note explains how to read the trends: because a new scan can surface issues or a fix can regress, the score and grade are designed to be able to fall, not just rise. It also clarifies that issue counts group every occurrence of the same problem, while instance counts count each occurrence separately.
This page appears once your site has at least two completed scans to compare. After a scanning-engine update it may be absent for a couple of weeks while fresh history builds up.

Recommended Next Steps
Three fixed steps, always shown in priority order, each labeled with what completing it does for your score:
- Review – confirm or dismiss the issues still awaiting a human decision. This releases the part of your grade held down while they’re unconfirmed. Unlocks: the held grade.
- Fix – work through your confirmed issues, starting with Critical ones since they carry the most user impact and cap the letter grade. Raises: the score.
- Test – continue manual testing in Visual Mode. Manual testing and real-user evaluation catch barriers automated scanning can’t, and finishing your planned pages lifts the ceiling. Lifts: the ceiling.
A footer note points you to the next page, where your top priority issues are detailed.

Top Priority Issues to Fix
Your top 3 priority issues, in impact order – not strictly by severity alone, since priority also weighs how many instances an issue affects. A high-instance Very High issue can rank above a Critical issue that only affects one instance.
Each issue is a card with:
- A severity badge, the issue number (matching its number in the app), the WCAG success criterion it fails, and its total instance count.
- What’s happening – a plain-language description of the failure.
- Where it’s happening – the affected pages with a per-page instance count, collapsing to “+N more pages” once there are more than a few.
- How to fix it – numbered steps to resolve it.
A footer note confirms this page always covers your top 3 priorities; see the Issues screen in the app for the full list.

xlsx Report File
Looking for a CSV export? AAArdvark doesn’t generate a CSV directly, but the xlsx report covers the same ground – it opens in Excel or Google Sheets, and you can save or export it as CSV from there if that’s the format you need.
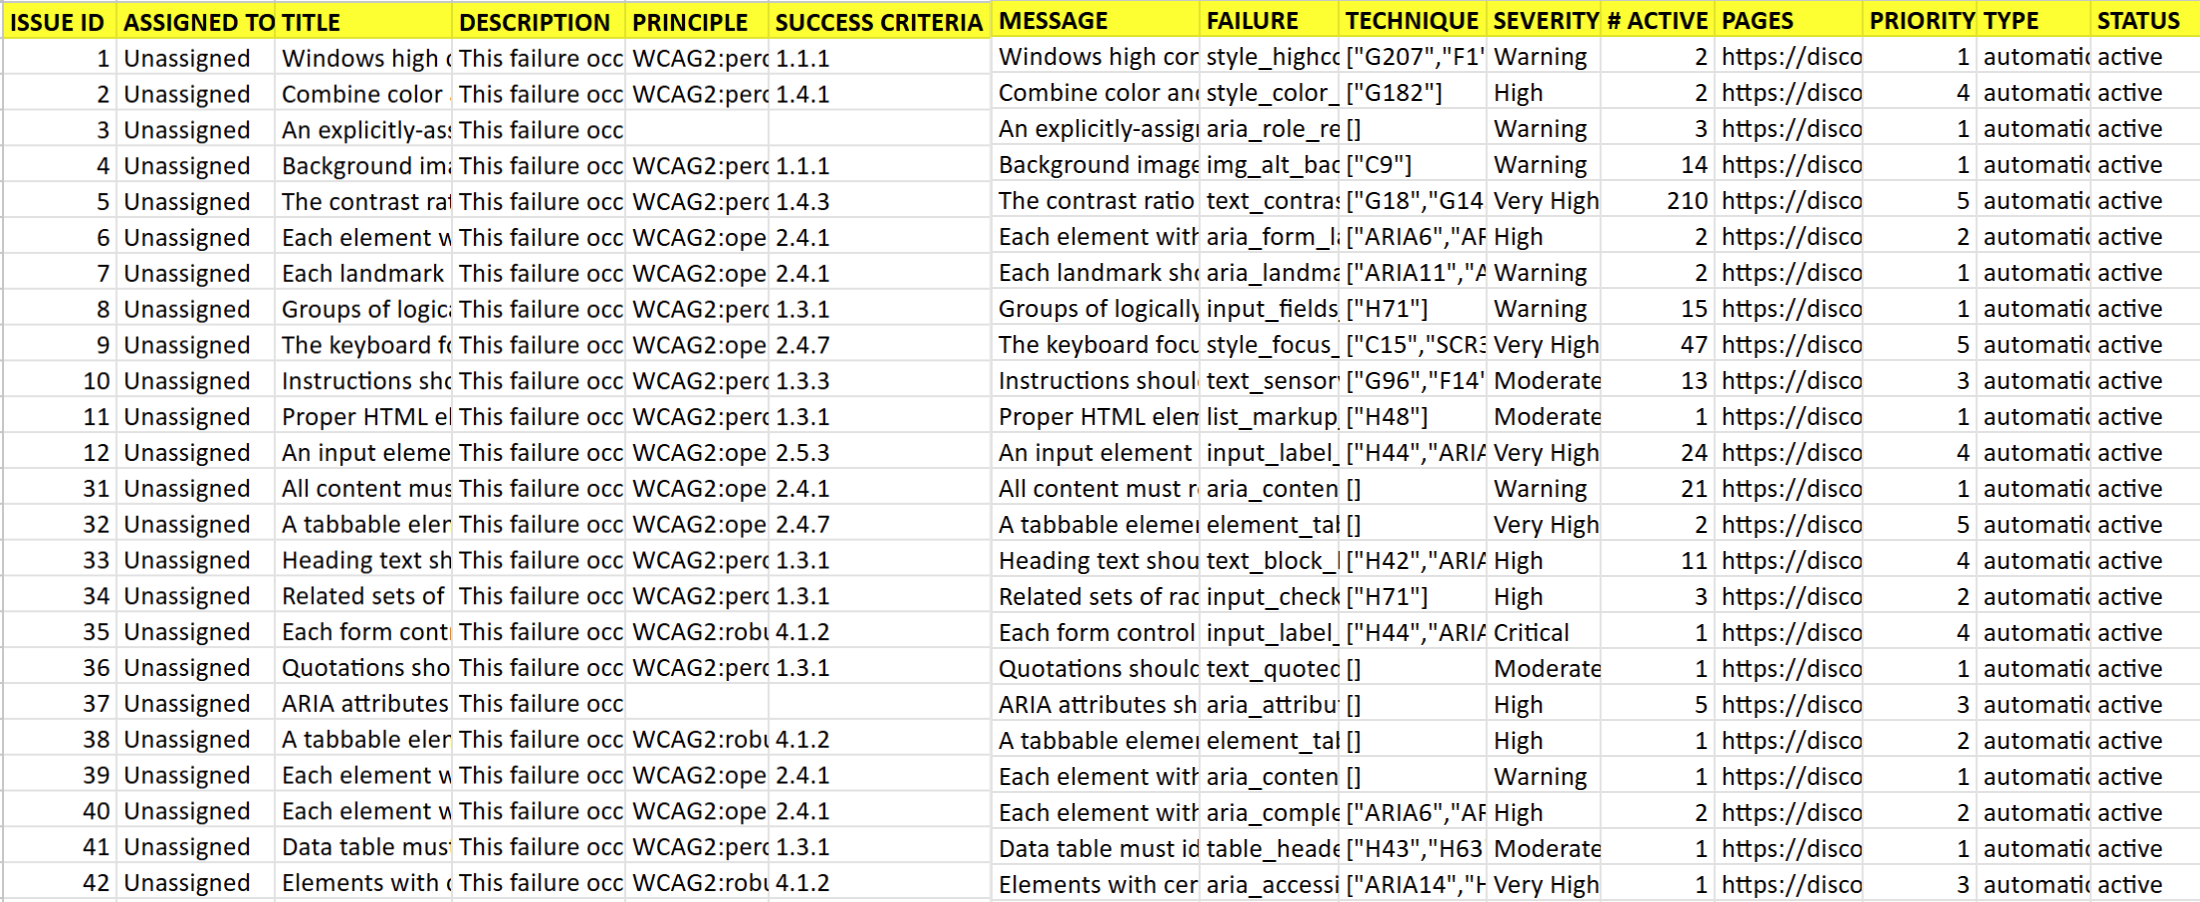
The xlsx report provides detailed, sortable data to help you manage accessibility issues efficiently. It includes:
- Issue ID and assigned team member
- Title (the WCAG failure title for the issue, or the issue message when no failure is linked) and description (the WCAG failure description)
- WCAG level and associated principle
- Success criteria, failure, and recommended solutions/techniques
- Severity level, number of active instances, full page URLs, and priority level
- Source of the issue (automated scan or manual audit)
- Issue status (active or resolved)